Origin 2019b Feature Highlights

How do I get Origin 2019b?
This new version will share the same settings with versions 2018 and 2019. If you have version 2018 or 2019, you can simply install and run this new version. No license activation is needed as long as you are eligible for 2019b.
Feature Highlights
HTML and Markdown Reports
Create custom reports using either Markdown or HTML syntax.
- Use Origin's Notes window to create the report
- Use Markdown or HTML syntax
- Copy and paste-link metadata, analysis results, and graphs
- Support for Placeholder sheet to copy and pre-format results for placement in report
- Report can be embedded in workbook for use as Analysis Template for batch analysis
- Report can be printed, or exported as web page with all associated images.
Read More...
Data Connectors
Data Connectors provide a set of enhanced features for importing and organizing your data.
- Connect to a web file, or a file on your local PC or network
- File types supported: CSV, Excel, ASCII/Binary (using Import Wizard filters), HTML, JSON, MATLAB, and Origin Projects
- Select data to be imported, such as specific node in XML, table in HTML, or Sheet in Origin Project
- Connection and data selection information is saved in worksheet/workbook
- Add connectors of same type to multiple worksheets in a workbook, and different connector types to multiple workbooks
- When saving the Origin project, you can opt to leave out the imported data associated with all connectors, or specific connectors. This can help reduce project file size. All calculated results and graphs from results will not be cleared.
- Re-import data from the source file any time. Make changes to source or to data selection at any time.
- More data connectors available for download from the App Center or from Data menu.
Read More...
Origin Project as Data Repository
Use Origin project files to organize and archive your data. Access your data from Origin using the new Origin Data Connector.
- Use Origin's flexible hierarchy of Folders, Subfolders, Workbooks and Sheets to organize and archive your data from multiple sources or measurements. Add metadata information such as comments to worksheets to describe your data.
- Save such ""Data Project"" to a local folder, or even a web sever. You can then share the source location with your colleagues/collaborators.
- Launch Origin on any PC with access to the data source. Then use the ""Origin Data Connector"" to connect to the ""Data Project""
- Select specific worksheets from the ""Data Project"" to import the data and perform your graphing and analysis on that particular subset of data.
- Connect to one or more ""Data Projects"" from your current project for flexible management of your graphing and analysis operations.
Read More...
Clone an Origin Project
Clone an Origin project to easily replicate graphing and analysis tasks with new data.
- Set up a Master Origin project with your desired data, graphs, analyses, and reports.
- Clone the project. This will create a duplicate project without the data.
- Import new data to update all graphs, results and reports.
You can also use the clone feature for exploratory analysis of large projects.
- Clone your large Origin project containing data, graphs, and analyses.
- Opt to maintain Data Connector links to the data sheets in the original project from your cloned project.
- You can then re-import any particular data sheet from the original project to continue further analysis and exploration of that subset of data.
- This avoids duplicating large projects containing the same data, and can speed up the exploratory phase of your data analysis.
New Graph Types and Graph Enhancements
The following new graph types and graph enhancements have been added in version 2019b:
- Split Heatmap
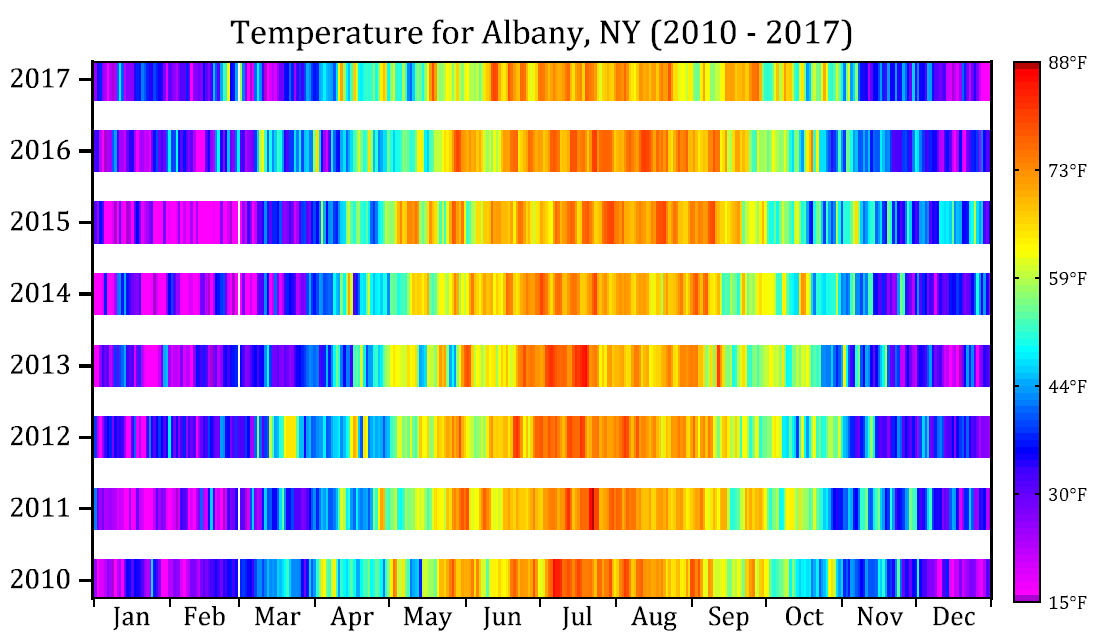
- Rug Plot - Add rug marks to axes
- Soil Texture Triangle
- Heatmap from XYZ or XY data
- Custom line segments
- Windrose with open circle for calms
Add gap between heatmap cells in x and/or y.
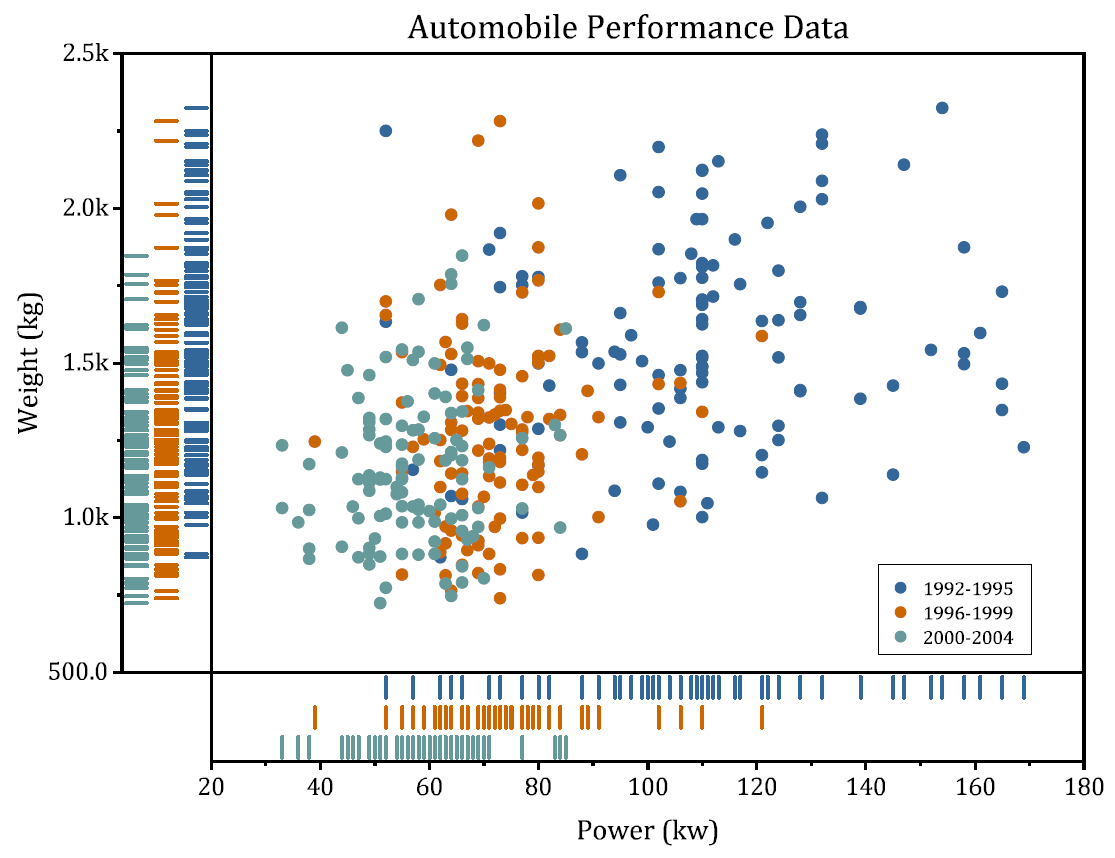
Add rug marks to axes to indicate data density.
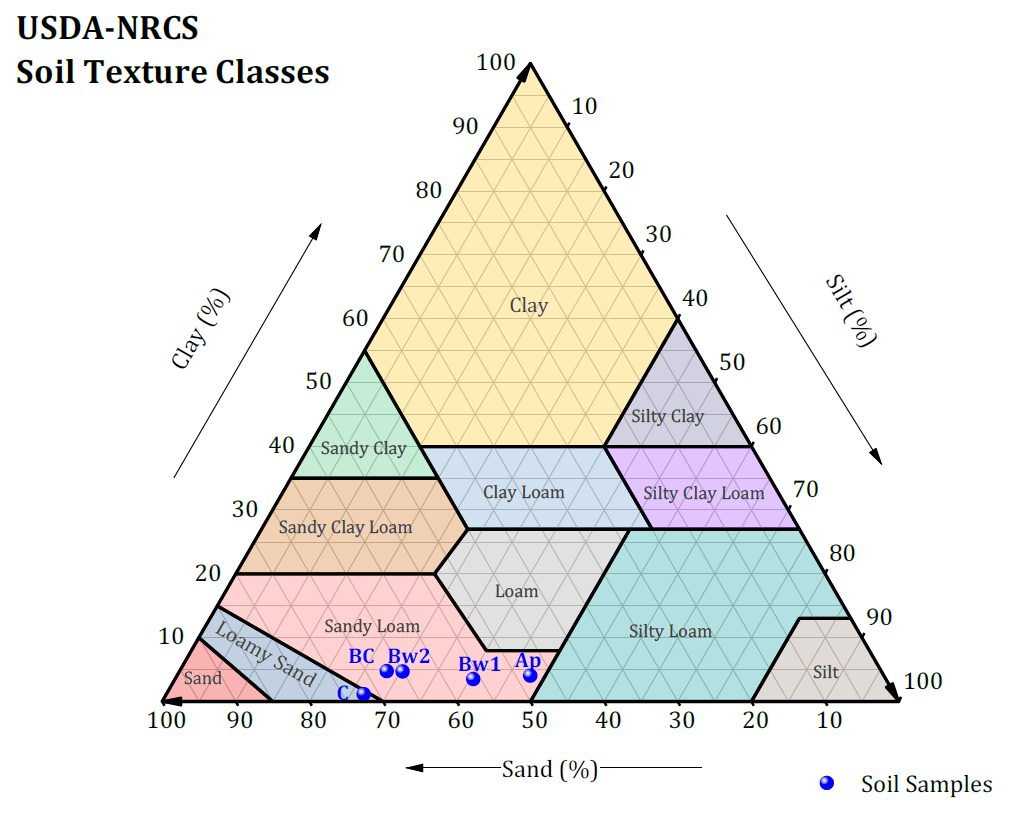
USDA-NRCS Soil Texture Classes. The procedure to create such graphs is included in a sample file under Graph Samples in Origin's Learning Center.
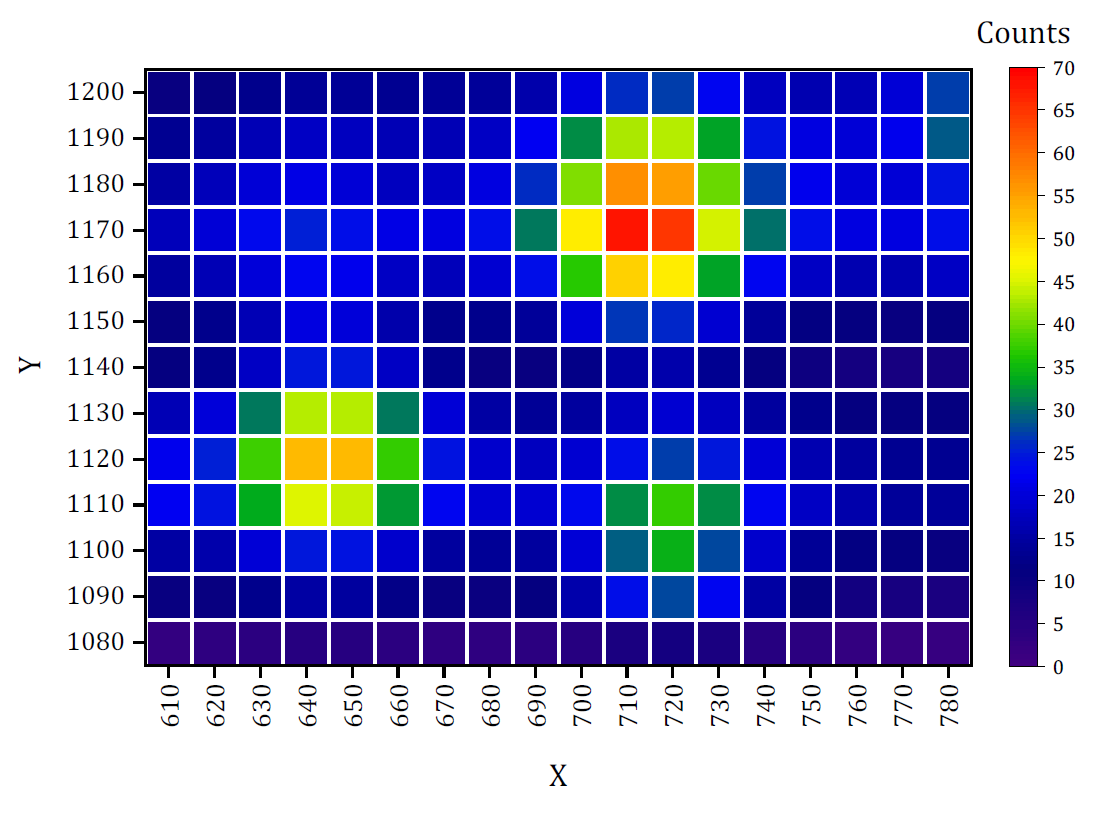
Create Heatmap plot from XYZ or XY data columns. Option to specify custom bin settings for X and Y. Generate output with counts, sum, min, max, mean, median or percent frequency.
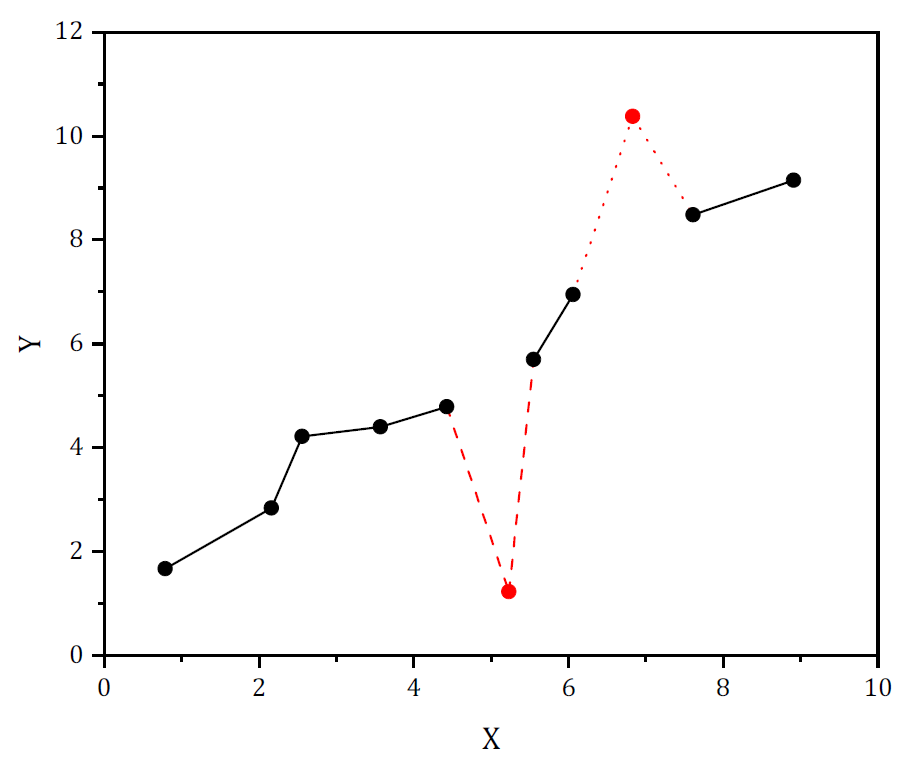
Customize individual line segments in a line or line+symbol plot.
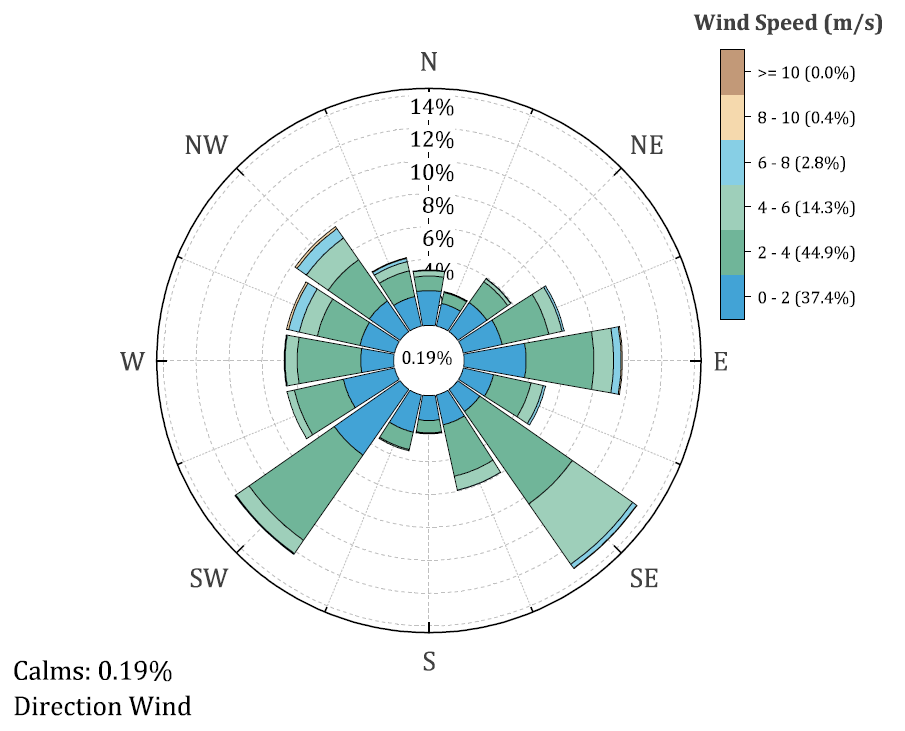
Windrose plot with open center to indicate calms.
Improved Plot Menu and other Menus
Several improvements have been made to Origin's main menu in this version:
- System templates in the Plot menu have been organized in easy to access categories.
- Plot menu also provides quick access to User Templates, and the Graph Maker App.
- A new Data menu has been introduced for the new Data Connectors and for all other import operations.
- A new Insert menu for Graph window to add plot, function, error bar, layer, table, image, etc. to an existing graph.
- A new Preferences menu provides access to settings and preferences, including themes.
- A new Connectivity menu provides access to tools for communicating with other applications.
Validation of Origin's Analysis Results using NIST Data
In this version we have included a set of sample projects that compare Origin's analysis results with certified values from National Institute of Science and Technology (NIST). Results are presented using Origin's new HTML and Markdown Reports, as described above.
Examples cover Linear Regression, Polynomial Regression, Nonlinear Regression and ANOVA.
Samples can be opened from Origin's Learning Center dialog (F11 key) and are located in a new category named "Validation" under Analysis Samples.
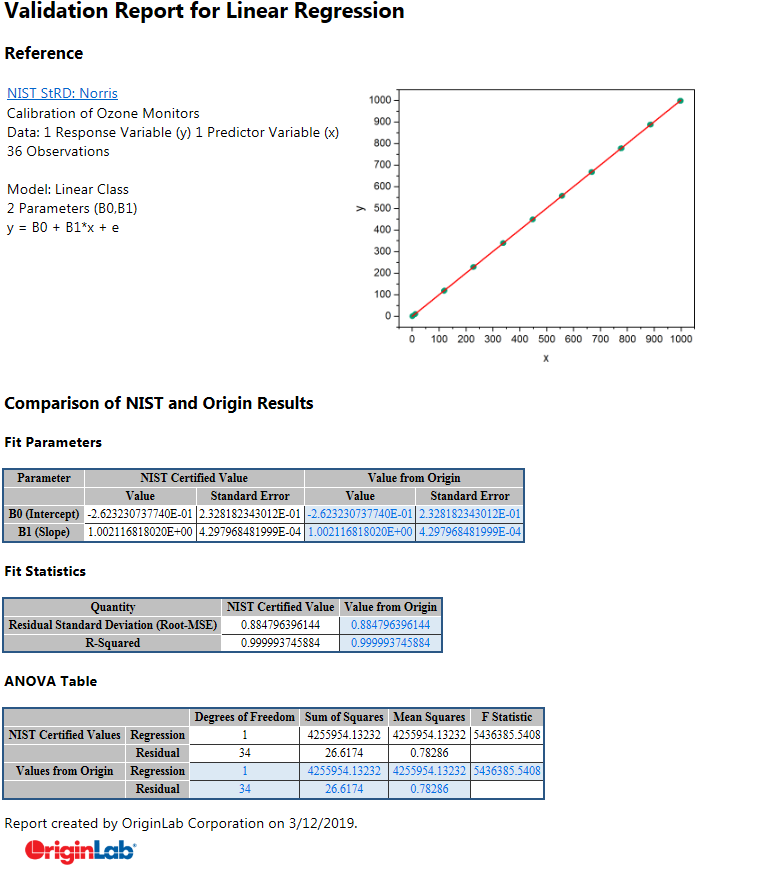
Linear regression results from Origin compared to NIST Certified values.
New Apps
In addition to the Data Connector Apps accessible from the Data menu, the following new Apps are available with this latest version:
- Speedy Fit ►
- Fit ODE ► PRO
- Quantile Regression ► PRO
- Hysteresis ►
- 2D Correlation ► PRO
- Gel Molecular Weight Analyzer ► PRO
- Change Point Analysis ► PRO
- 3D Windrose ►
- Concave Hull ► PRO
- Isosurface Plot ►
- SAS XPORT Connector ►
- PLEXON Connector ►
Other Features
General
- Copy and paste a workbook or an entire project folder, within or across Origin sessions.
- Faster ASCII and CSV import - almost 50% faster
- Export multi-page workbook to multi-page Excel file with option to exclude individual sheets
- Save Project without imported data to reduce file size
- Highlight data plot in graph and simultaneously highlight source data in worksheet
- Recently used fonts shown at top of Font drop-down list
- Font control for Notes window
- Copy graph and paste directly to online documentation tools, e.g. Confluence page
- Sort Apps in Apps Gallery alphabetically or by date
- Improvements to Group Folder for sharing across multiple groups
Graph Customization
- Layer frame will follow bottom X axis settings
- Use Number of X columns in worksheet to determine number of layers in Stacked and Multi-Y Axes graph
- Group plots in "Stack lines by Y Offset" graph using column label row data
- Line style customization for 3D Vector graph
- Use Color Lists for colormapping
- Set fixed symbol edge thickness when symbol size scaled by another dataset
- More customization of legend symbols: show pattern only or fill color only, scaling of text in legend
- Label each layer in merged graph with source graph short name. More label position options
- Add labels to specified indices of waterfall plot
Analysis
- Vertical cursor- combine all labels into one
- Compare output from two vertical cursors
- More options in Statistics and Cluster gadgets
- Save workbook with no operation as Analysis Template
- More options to split worksheet columns
- Use column Short Names directly in worksheet queries
- Extract worksheet rows by random sampling
- Recalculation support for split worksheet
- Filtering columns in worksheet Column List View
- Support Censor Mark in Survival Plot