Origin 2025b Feature Highlights

Project Browser
This new dialog provides a list view of contents in the current project and a quick way to edit items.
Key features include:
- Reduce list by type such as folder, graph, workbook, sheet, column etc.
- Display items from entire project or current folder/subfolders only
- Sort list by name, path, size, modified date etc
- Search items by strings in name, path, comments, date, size, note etc.
- Mouse over items for preview and double click to activate
- Edit multiple selected items such as bulk rename, change formula, delete, hide etc.
Blog...
Modern Search Box
A new search tool has been added to this version with several key features:
- Search box on top of the interface for easy access
- Perform tasks such as plotting and analysis by keyword search and then click to execute
- Find results in various areas such as menus, toolbars, Apps, samples, FAQs etc.
- Recently typed keywords are displayed for quick repeat search
- Recent actions are displayed to quickly launch the tool
- Context menu and Mini toolbar results displayed along with tooltip on how to access them
Key Chords for User-defined Shortcuts
This version provides a new mechanism to create hotkeys to speed up your work.
- Ctrl+Prefix+2nd Key mechanism to allow more hotkeys
- Ctrl+click on menu, toolbar button, apps to define 2nd key
- Ctrl+Prefix (\) to view all available keys
- Preferences: Key Chord... dialog to manage Prefix and 2nd Keys.
- Create Key Chord for running LabTalk Script
Recent Files
Use the Recent Files button located at the bottom left of the workspace to quickly load recent Origin files or data:
- Supports Origin project (opju), workbook(ogw*) and graph (ogg*) files
- Search box at the bottom of the list to search keyword in file name
- Re-import data (imported by data connector) with previous settings
- Detailed file path is displayed on mouse over
Interactive Cell Referencing
Define cell formula with interactive cell or range referencing similar to Excel:
- Click on a cell to refer to the cell
- Click on a column header to refer to the whole column
- Drag a range of cells to refer to the range
- Works only within same worksheet
- Ctrl+E to highlight cells with formulas or links
Dialog for Setting Graph Options
This new dialog provides one place to define common settings for graphs:
- Common settings for axis, font, layout and legend
- Apply to active graph, graphs in folder or all graphs in project
- Set as default for future new graphs
- System variable @GGO to control types of graph templates to apply settings (default: 1 = system templates only)
Window Switcher
This feature provides a quick way to switch to a different window in your current folder:
- Ctrl+Tab (forward) and Ctrl+Shift+Tab (backward) to toggle child windows with preview
- system.pagenav.compact=0 to block all workspace
Trend Lines in Graphs
Add trendlines to your graph to visualize trends in your data:
- Mini toolbar to add trendline for single or multiple plots
- 6 trendline options: Linear, Polynomial, Power, Logarithmic, Exponential and Moving Average.
- Support for fixing parameter values
- Mini toolbar to customize trend line and label
Report Sheet Graph Size and Arrangement
Graphs embedded in report sheets can now be customized:
- Mini toolbar button to change graph size and number of graphs per row
- Save settings as default
- Customize one graph and apply style or scale to other graphs
- Graph width and number of columns included in Report Style dialog under Preferences menu
Stats GUI Mode with Pre-installed Stats Apps
The installer in this version provides two check boxes that allow you to:
- Pre-install important Statistics Apps such as SPC, DOE, GLR etc. as part OriginPro installation
- Switch to a Stats Mode GUI with reduced menus and toolbars, and re-organized Plot menu focusing on statistical features
- Users can toggle between Stats Mode and Default Mode for GUI from the Preferences: GUI Mode menu
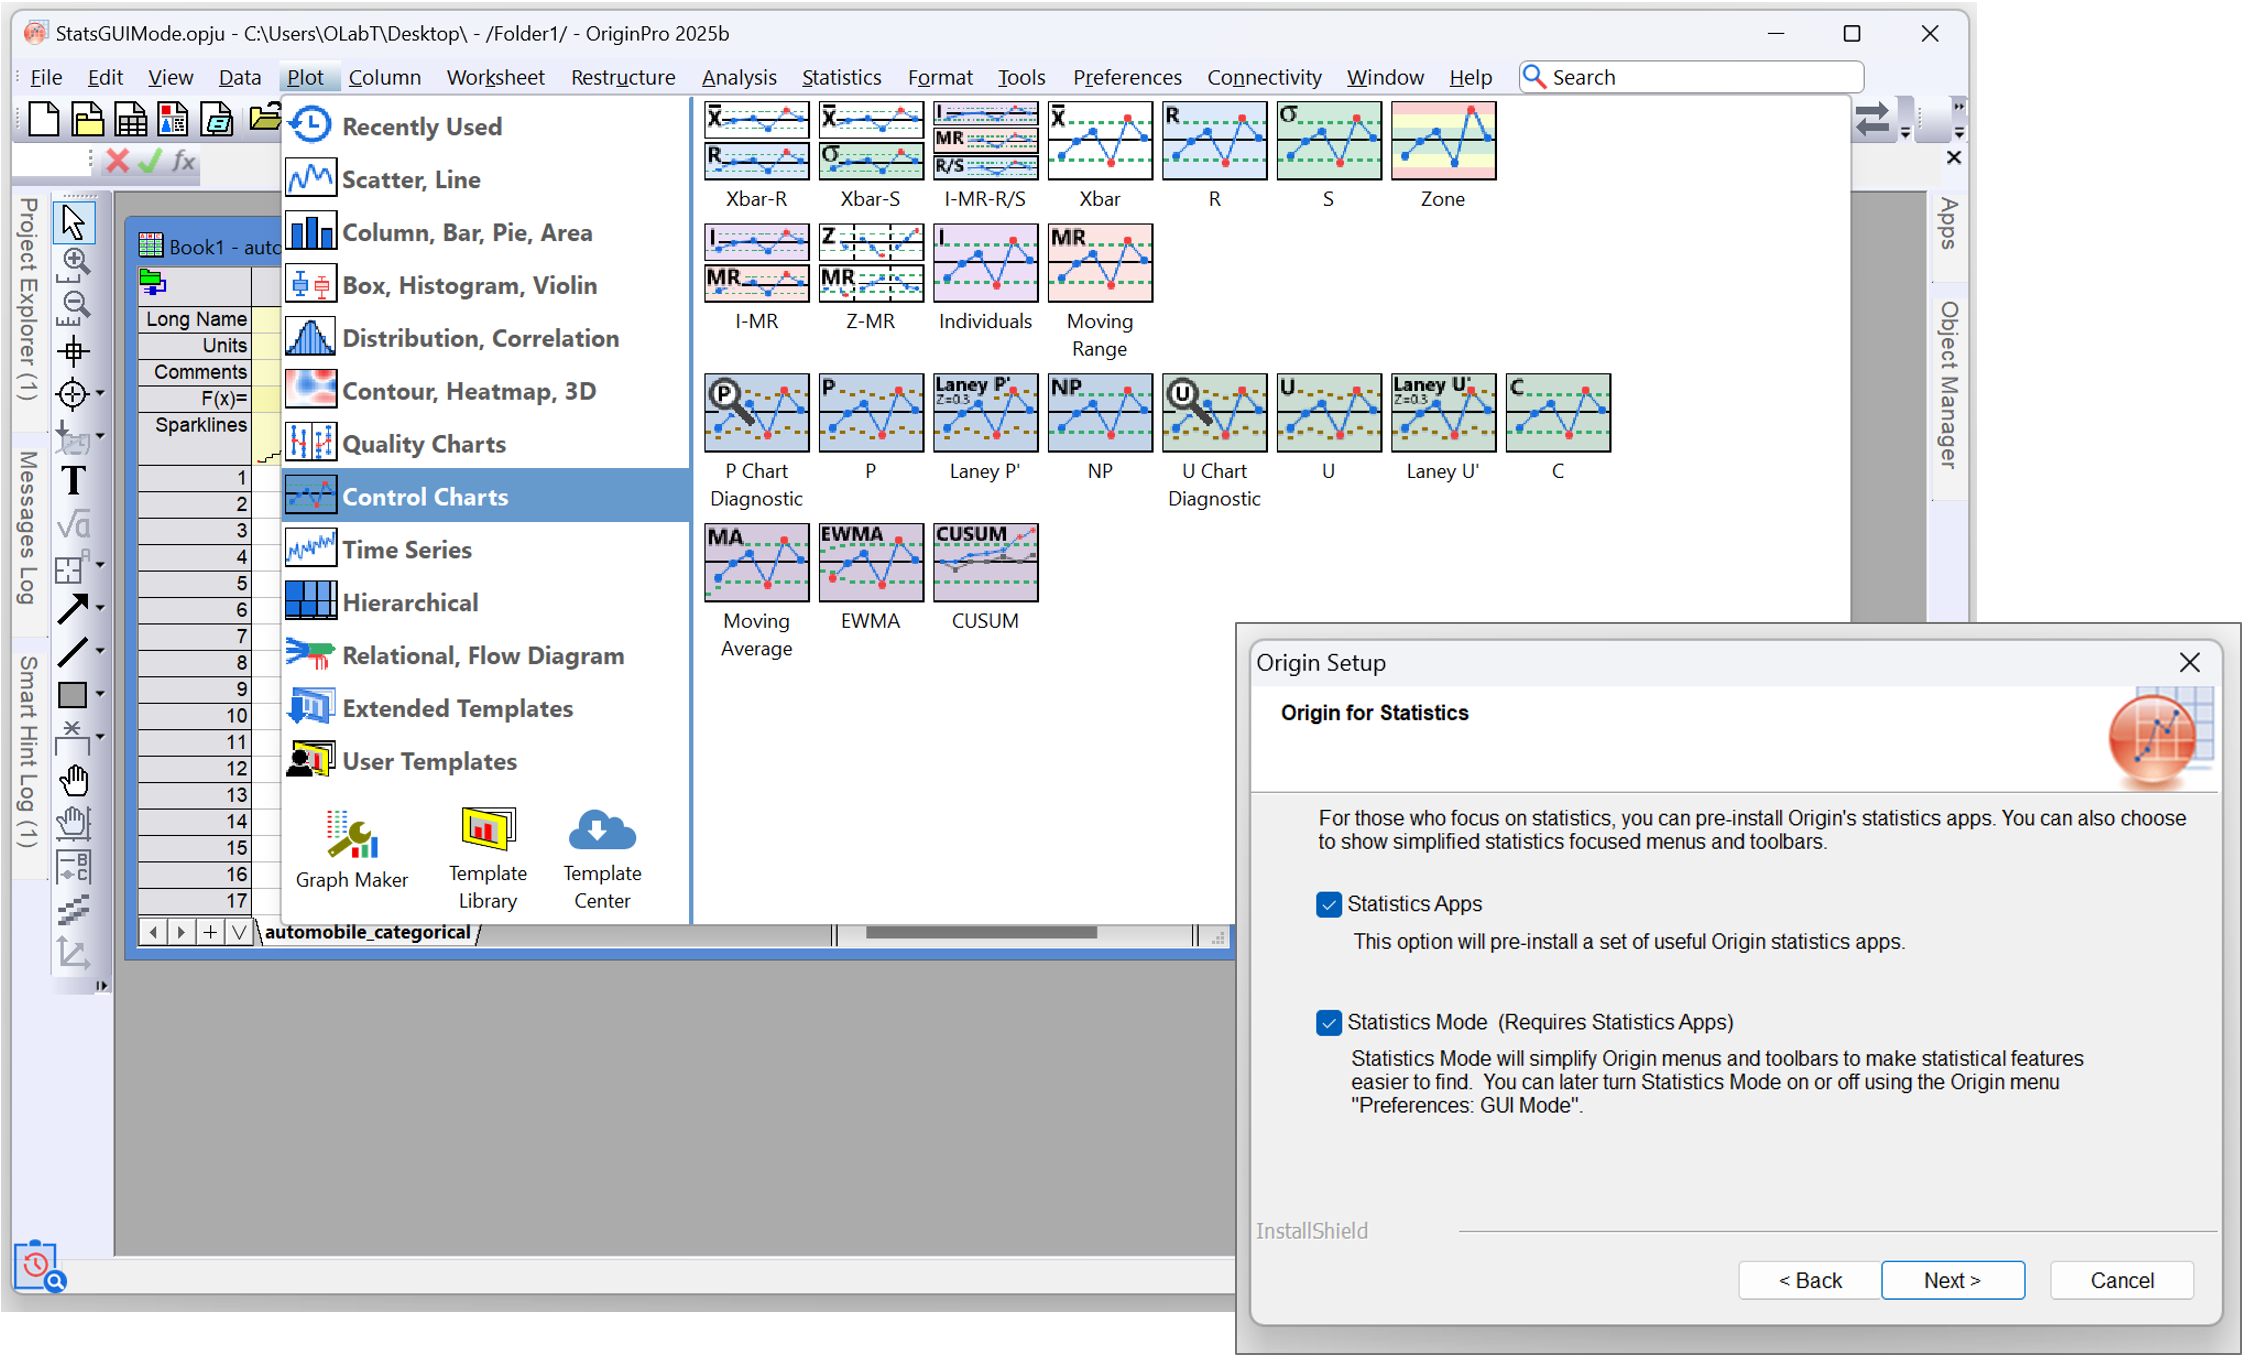
Option during installation for pre-installing Statistics Apps and switching to simpler GUI with re-organized plot menu
New Graph Types
The following new graph types have been added in this version:
- Treemap
- Heatmap with Dendrogram
- Heatmap with Grouping
- Polar Vector
- Polar Quiver
- Normal CDF Plot
- Interaction Plot
- Main Effects Plot
- Run Chart
- Symmetry Plot
New Apps
The following new/updated Apps are available with this latest version:
Improvements to Key Statistics Apps
Several key improvements have been made to GLR, SPC and DOE Apps:
General Linear Regression
- Support stepwise model selection
- Support response optimization
- Support K-fold cross-validation
- Support prediction of Y from given X, with confidence and prediction intervals
- Improved model term selection in dialog
- More results in the report, including Effects Plot, VIF, AICc, BIC, Predicted R-Square, and Outlier Detection using residuals
.
Design of Experiments
- Support Mixture Design
- Support stepwise model selection
- Support center points in the model
- Support defining custom design from a worksheet
- Support setting weights for responses in optimization
- Provide more results in the report, including coded/uncoded coefficients, VIF
- Improved model term selection in dialog
Statistical Process Control
- Add additional reports to the capability analysis output sheet, such as Summary Report, Stability Report, and Normality Report
- Support timestamps in control charts
Other Features
General
- Pin files on top of the Recent Origin Files dialog
- View: Hide Toolbars
- Better menu gap and font size on high DPI
- No dramatic font size change in render and edit mode of Notes window on high DPI
- Hot keys for Tools toolbar buttons
- Keep the Unlock Imported Data status after reimport
- Source info. on tooltip of result sheet in Object Manager
Graphing
- Better default graph page layout
- More geometric polygon shapes e.g. rounded rectangle, triangle, trapezoid, diamond, pentagon
- Mini dialog to add reference lines
- Slicer on browser graphs and extract sliced data
- Auto group with existing plots when drag & drop new data into graph
- Protect graph from being edited or deleted
- Toggle show/hide of masked points on individual graph
- Uneven heatmap gaps
- Box chart tooltip for range, count, mean, median, 25%, 75% and upper/lower whiskers
- Change graph page DPI
Data Handling
- Conditional formatting to highlight min/max column-wise or row-wise
- Conditional formatting of Top/Bottom, Pareto, and Outlier
- Paste (insert) copied cells
- Remove masked cells or cells with missing values
- Query data from multiple sheets
- Mini toolbar to change column format: Numeric, Text Date, Time, etc.
- Autofill on absolute reference in cell formula
- Paste a single line text into one cell by default