In Origin 2016, many improvements are introduced for data analysis, statistics and batch processing.
Clone Workbook for Repeat Analysis 
Origin provides a quick yet powerful way to apply cell formatting and data analyses made in the active workbook to multiple imported files, by treating the current workbook as a temporary template.
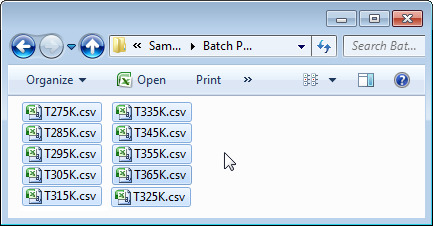
Import Multiple Files into cloned workbooks/sheets for Batch Processing
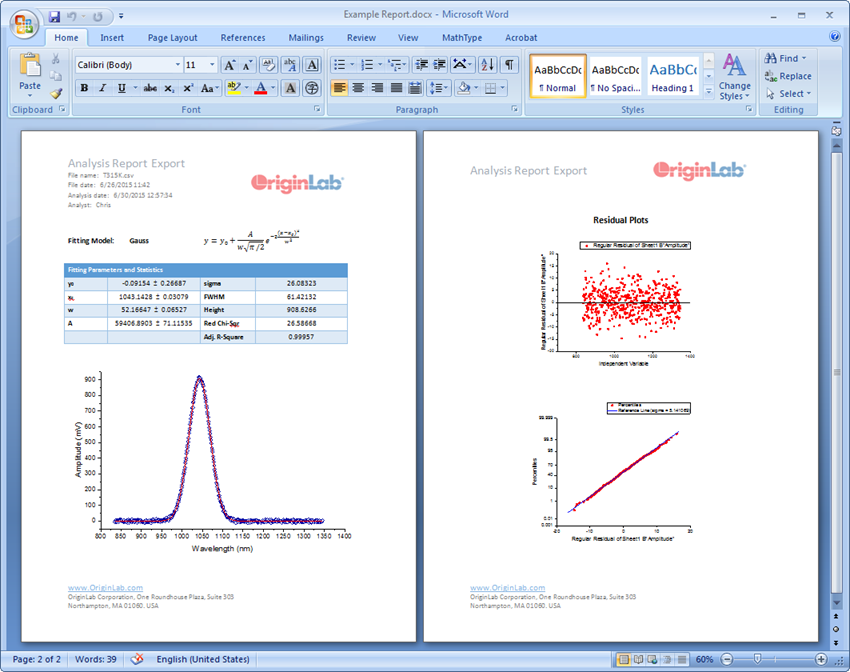
Fig. Word Template used for Report Creation during Batch Processing
- Support Word Template for Report Creation in Batch Processing
- Batch Processing with Analysis Template applied to Multiple Files imported to Sequential Worksheets
- Script Before Each Process in Batch Processing
- Append Results by Columns in Batch Processing
- Easier way to customize Report Table in Graph for Linear and Non-linear Curve Fit
- Display Equation with parameter values in Graph after Non-linear Curve Fit

Fig. Easier way to customize Report Table
- Partial Correlation Coefficients PRO
- Improvements: Means Comparison on Interaction Combinations in Two-Way ANOVA
- Improvements: t-Test for Summarized Data
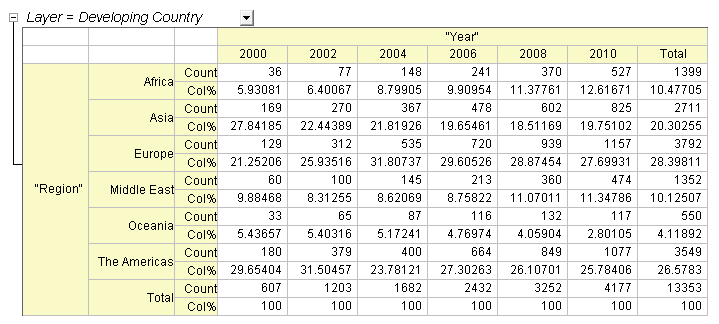
Fig. Results of Cross Tabulation
- Set upper and lower bound of peaks
- Easier way to customize Report Table and Peak Properties table