In Origin 2016, many improvements are introduced to make Origin ease of use.
Object Manager 
The Object Manager in Origin 2016 makes it easy to manage plots on a graph.
- Show or Hide plots individually by selecting/clearing a check box
- Hide/Show a set of plots with the same name
- Change the order of plots in the same layer
- Change the plot style
New, Powerful Color Chooser
New Color Chooser makes it easier to pick from a large selection of color lists, and define your own.
- Set color as Single, By Points or By Plots
- Large Selection of Color Lists with Varying Luminance
- New Custom color dialog with Color Picker
- Save/load Custom color lists
- Recent Colors list
Tab-based Dialogs
Curve fitting and statistics dialogs are tab-based for easier navigation.
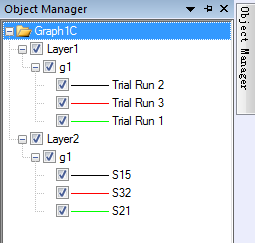
Fig. Object Manager
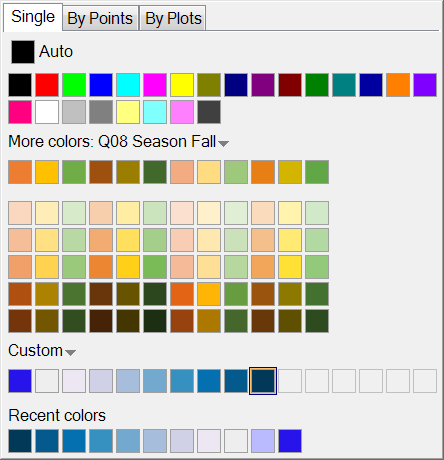
Fig. Powerful Color Chooser
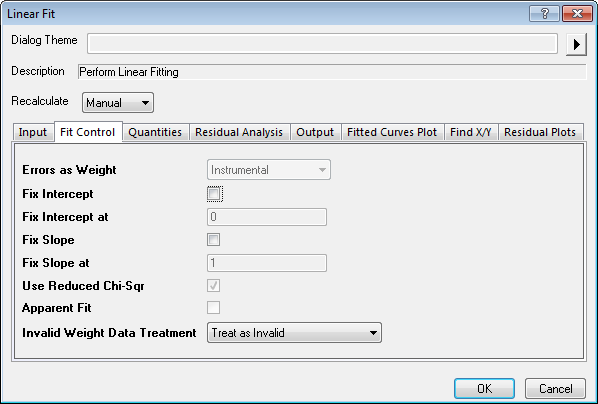
Fig. Tab-based linear fit dialog
- Switch Layers or Create New Layers and change Plot Order in the Layer Contents dialog
- "Hunt" button added to the Insert Variables dialog for easy insertion of worksheet variables/metadata into text objects
- Use Long name in the Plot Details dialog
- Set Units and Scientific Tick Label display in Tools: Options
- Set Graph Short Name and Long Name during Batch Plotting and when creating windows from custom templates
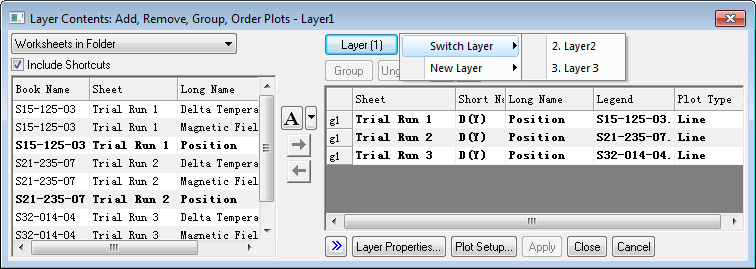
Fig. Switch layer in the Layer Contents dialog
- Define and access Project Variables in Set Column Values dialog
- Nested Sorting of columns in Project Explorer, Layer Contents and Data Browser dialogs
- Select or Hide Worksheet Columns by Long Name, Units or Comments
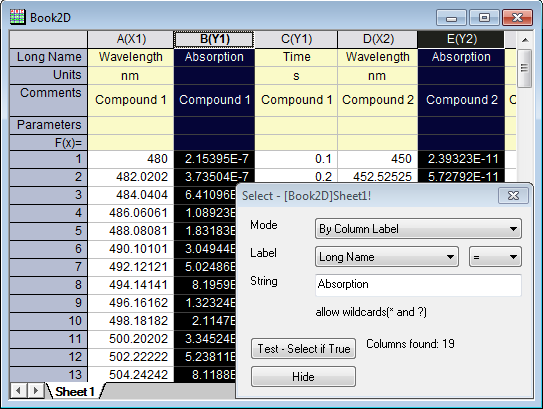
Fig. Select columns by Column Label