6.5.5 Multi-line-plot with Special Position Annotation LineMulti-Line-Annotation
Summary
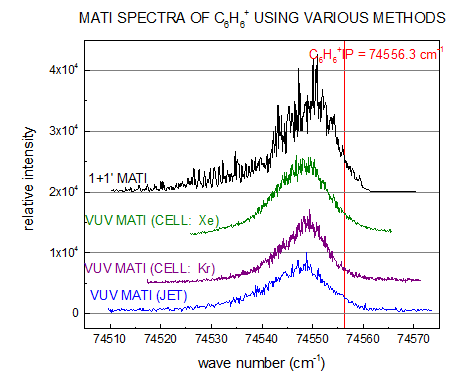
This tutorial will show you how to create a multi-line-plot with special position annotation line.
Minimum Origin Version Required: Origin 2015 SR0
Steps
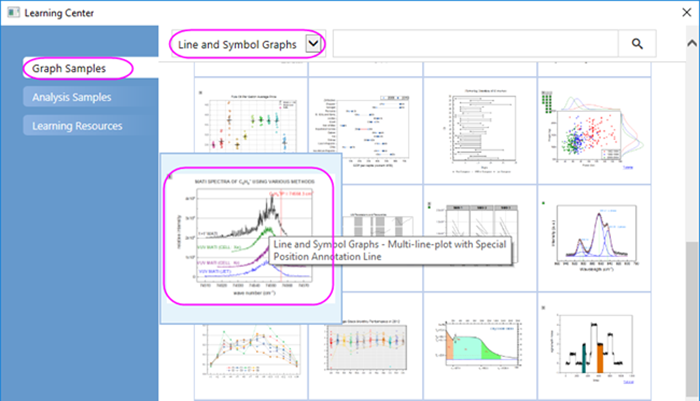
- Select Help: Learning Center menu or press F11 key to open Learning Center. Select Graph Sample tab and then select Line and Symbol Graphs from the "Category" drop-down list. Double-click on the graph sample below to open the sample "Line and Symbol Graphs - Multi-line-plot with Special Position Annotation Line".
Note: This tutorial is associated with the folder Multi-line-plot with Special Position Annotation Line of the "Tutorial Data" project:<Origin EXE Folder>\Samples\Tutorial Data.opju.
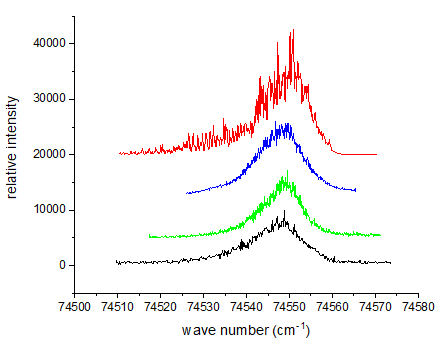
- Active to the worksheet in workbook Multi-line-plot with Special Position Annotation Line. To plot a multiple line plot, highlight all the columns in the worksheet, and click the Line
 button on the 2D Graphs toolbar. Delete the legend object from graph. button on the 2D Graphs toolbar. Delete the legend object from graph.
- Click on the left Y axis, and in the popup mini toolbar, click on the Tick Style button
 to select In in the list. to select In in the list.
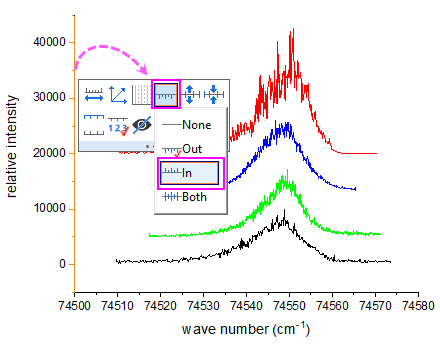
Click on the bottom X axis and do the same thing to set the axis tick style.
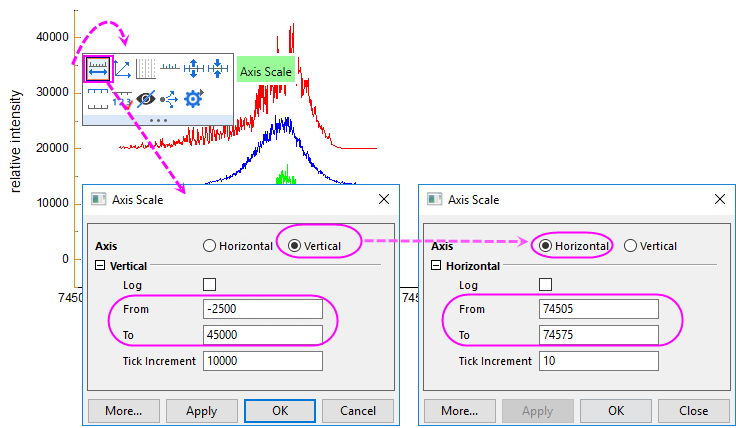
- Click on the left Y axis again, and in the popup mini toolbar, click the Axis Scale button
 to open the Axis Scale button to set the scale for X and Y axis: to open the Axis Scale button to set the scale for X and Y axis:
For X (Horizontal): From 74505 to 74575;
For Y (Vertical): From -2500 to 45000;
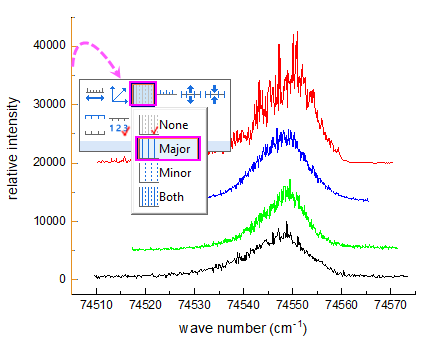
- Click on the left Y axis again, and in the popup mini toolbar, click Show Gradlines button
 to select Major from the list to show only the major grid lines. to select Major from the list to show only the major grid lines.
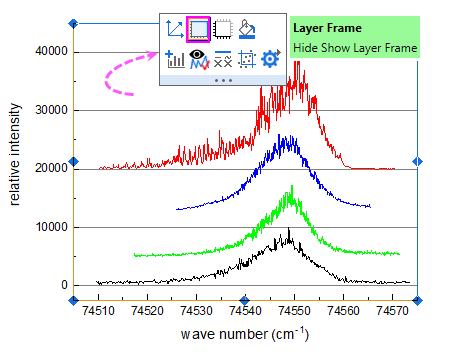
- Click any white space within the layer frame, and in the popup mini toolbar, click Layer Frame button
 to add a line frame on the graph. to add a line frame on the graph.
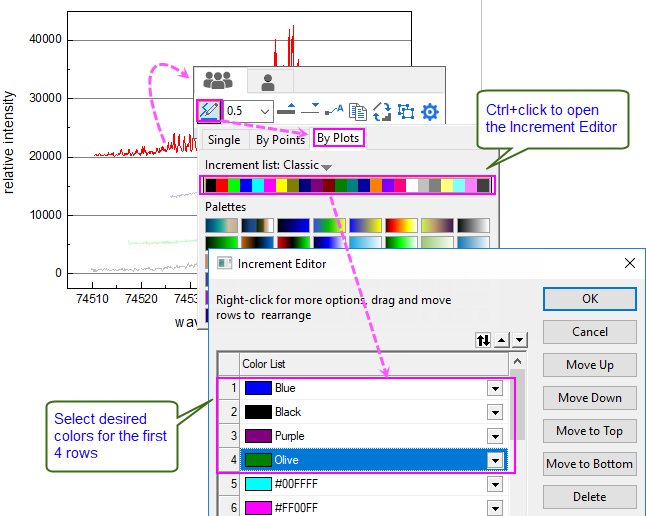
- Click on one plot, and in the popup mini toolbar, click Line Color button
 to expand the color chooser. Under the Group tab to expand the color chooser. Under the Group tab  , select By Plots sub-tab, by pressing Ctrl key, click the current color list to open the Increment Editor dialog to change the first four colors for the 4 plots. , select By Plots sub-tab, by pressing Ctrl key, click the current color list to open the Increment Editor dialog to change the first four colors for the 4 plots.
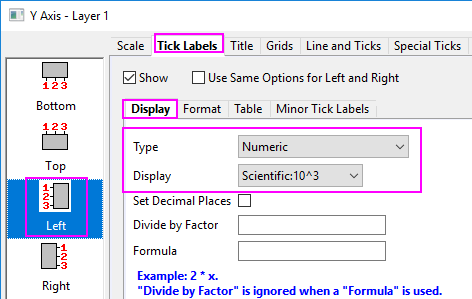
- Double-click on the tick labels of Y axis to open the Axis dialog. Go to the Ticks Labels tab and change the display format for Left into Scientific: 10^3. Click OK button.
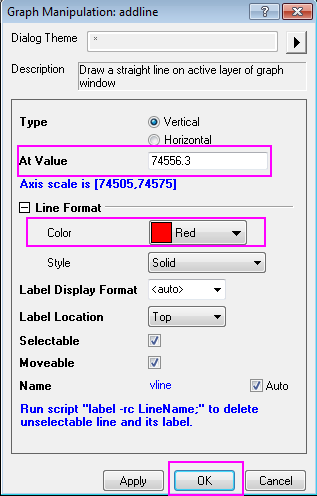
- Then, you will add vertical line on Graph, select Insert: Straight Line in main menu to open the dialog, set the X coordinates in the dialog, and set color: red, click OK to apply the settings.
- A straight line with text was added on the graph. Edit the Text object above the line object by double click it, the
 and and  in Format toolbar is helpful when creating superscripts and subscripts. Entering the content as shown in graph below: in Format toolbar is helpful when creating superscripts and subscripts. Entering the content as shown in graph below:
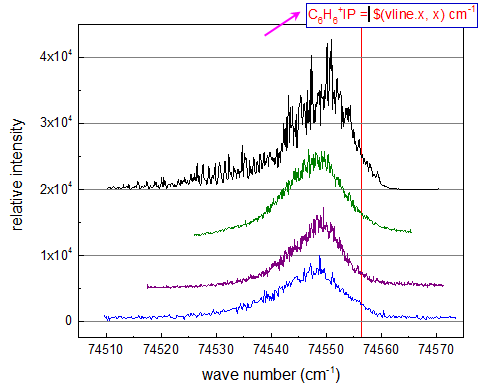
Then, click somewhere outside the text box to quit the text editing, drag to move the text to a proper position.
Now, the text object get the X coordinates of the line, when you drag to move the line object horizontal, the text also updates simultaneously.
- Add explanatory strings for line plot, add a title on the graph by using Text Tool as well.
 | There are 2 ways to edit text labels:
- In-place Text Editing: Double-clicking puts you in WYSIWYG edit mode. Using the Style and Format toolbars makes it easy to add formatting to any text. For special characters, the Symbol Map can be used.
The Symbol Map can only be opened while in In-place edit mode. To enter In-place edit mode, double-click on the text label. Then, open the Symbol Map by pressing CTRL+M. Or right-click inside the text label and select Symbol Map.
- Text Control dialog box (from previous versions of Origin): Hold down the CTRL key when double-clicking text. Highlight any portion of the text and apply the desired style, Greek font, etc.
You can also right-click on a text label and select Properties to open this dialog.
|
The finished graph is similar to the graph in Summary Section in this tutorial.
|