6.5.2 Fill Partial Area between Function Curvesfill-partial-area-between-curves
Summary
This tutorial shows how to plot two functions and customize the graph by partially filling an area between the two function curves.
Minimum Origin Version Required: 2017 SR0
What you will learn
- Generate function data using Set Values tool.
- Fill areas between two lines with different colors.
- Add and edit objects on your graph.
Steps
This tutorial with the Fill Partial Area between Function Plots folder in the project <Origin EXE Folder>\Samples\Tutorial Data.opj.
Filling Area Between Parts of Two Curves
To apply different fill colors to two or more portions of the curve, you need to plot curves in segments. In this tutorial, you will learn how to fill an area between curves defined by X <= 1.
- Open the Tutorial Data.opj and browse to the Fill Partial Area between Function Plots folder. Book2L contains two function curves (Note: To see how to generate a dataset from a function, see the last section of this Tutorial).
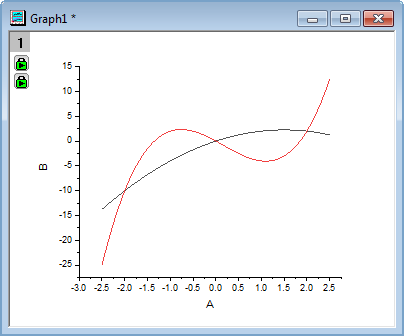
- Select rows 1~36 (-2.5 <= X <= 1) of all three columns in Sheet1 of Book2L and on the menu, click Plot> Basic 2D: Line to plot two lines. The two datasets (lines) are automatically grouped.
- Now, go back to the worksheet, select rows 36~51 (1 <= X <= 2.5) of all three columns and hover over the edge of the highlighted area until the cursor looks like this
 . Drag and drop the selected range, onto the graph you just created . If prompted to rescale the axes and show all data, choose Yes. . Drag and drop the selected range, onto the graph you just created . If prompted to rescale the axes and show all data, choose Yes.
- Select and delete the legend and the axis title.
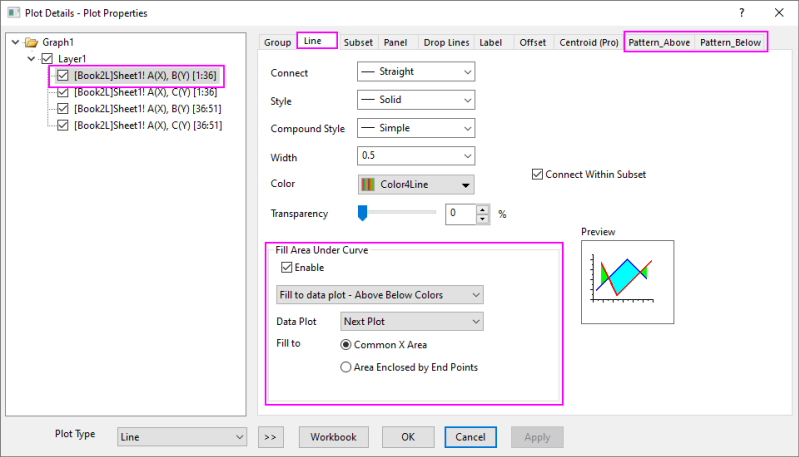
- Double-click on one of the line plots, to open the Plot Details dialog box. Select the 1st plot under the Layer1 node on left panel.
- Go to the Line tab and below Fill Area Under Curve, select Enable. Set Fill to data plot - Above Below Colors, Data Plot = Next Plot, Fill to = Common X Area, then click Apply.
Notice that this action adds a Pattern_Above and a Pattern_Below tab to the dialog box.
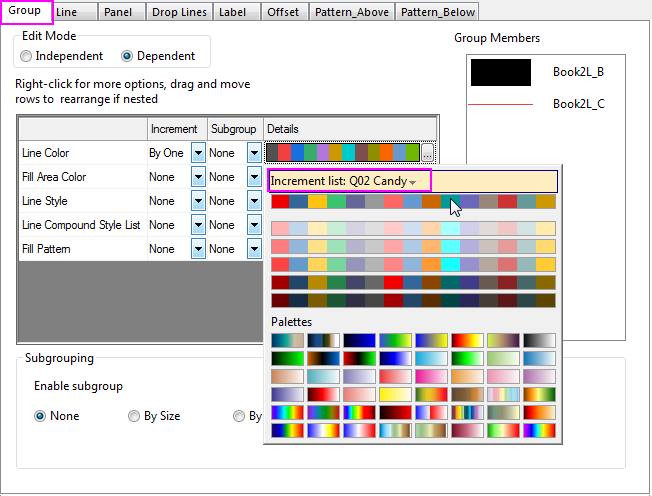
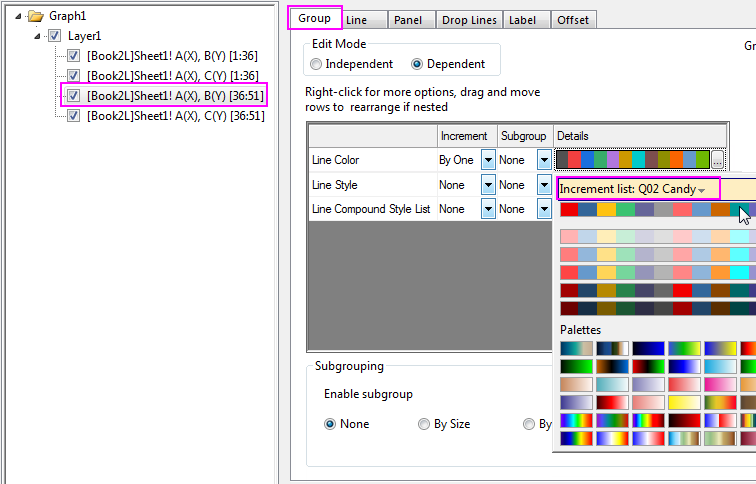
- Go to Group tab, click the line color list in the Details column to select the increment list Candy as below:
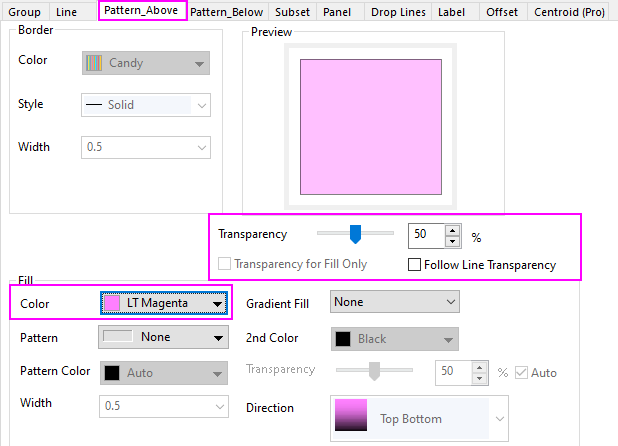
- Go to the Pattern_Above tab and set the fill color of the black line to LT Magenta with a 50% transparency.
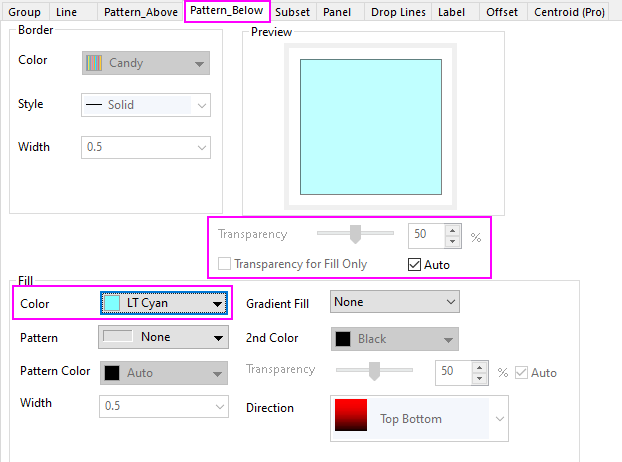
- Go to the Pattern_Below tab and set the fill color below the black line to be LT Cyan. Note that transparency controls for Pattern_Below are dimmed and set to Auto, meaning that the fill will use the same transparency settings as Pattern_Above).
- Select the third plot in the left panel, go to Group tab, click the line color list in the Details column to select the increment list Candy as below:
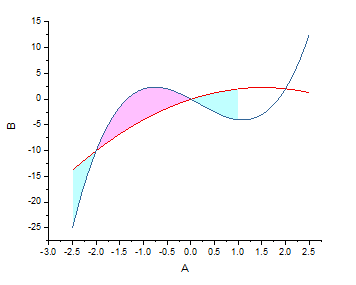
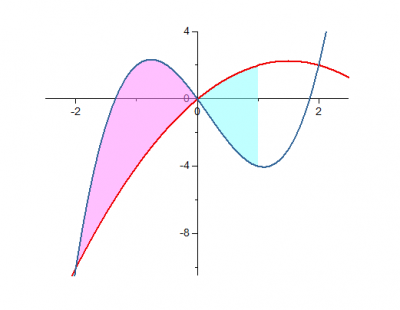
- Click OK to close the dialog box. The area in between the curves where X<=1 is now filled.
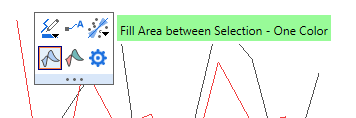
 | As an alternative to the Plot Details Line tab controls, note that you can select any two plots in the graph layer using the Ctrl key, then apply fills between the selected curves using Mini Toolbar buttons.
|
Changing the Axis Range
- We want to change the display range of X and Y axis. To do this, click on the X axis, and in the popup mini toolbar, click the Axis Scale button to open the Axis Scale dialog as below. Set the display range from -2.5 to 2.5 with Tick Thickness = 2.
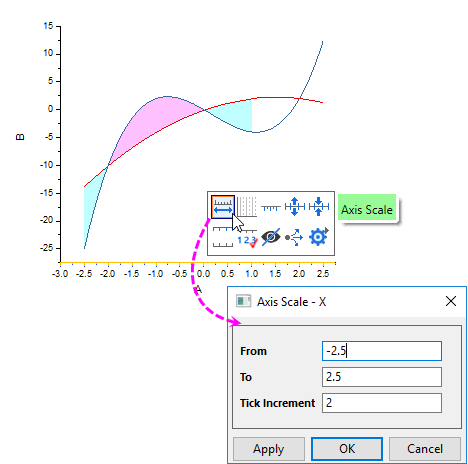 - Do the same for Y axis to set the Y axis display range from -10.5 to 4 with Tick Thickness = 4.
- To configure the X and Y axes so that they intersect at 0,0. Double-click on the X axis to open the Axis dialog, go to the Line and Ticks tab, select both Bottom and Left icon in the left panel of the Axis Dialog. Set Axis Position to At Position = 0.
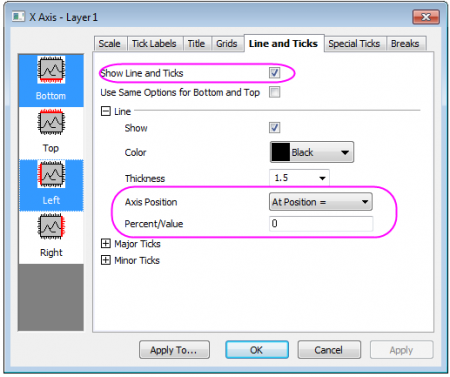
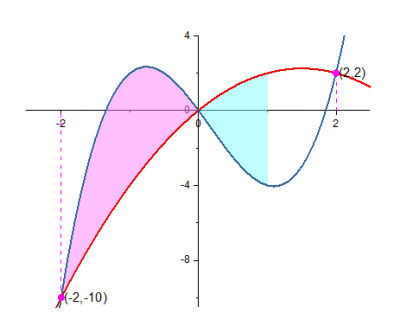
- Click OK to close the dialog. Delete the Axis titles, and then select the two line groups separately to set Width to 2 both using the style toolbar. Then, the graph will looks like:
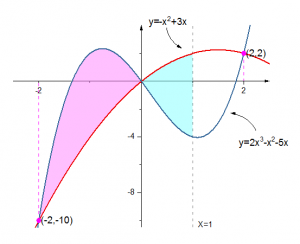
Adding Special Points with Labels to Annotate the Intersections
In the graph above, there are three intersections of two function curves. We want to mark two of them, at X=-2 and X=2 respectively.
- With Ctrl key been pressed down, click on the intersection at X=-2 to select this individual point and then right-clicking on it to select Edit Point to open the Plot Details dialog. You can learn more about how to show and customize a individual point on graph.
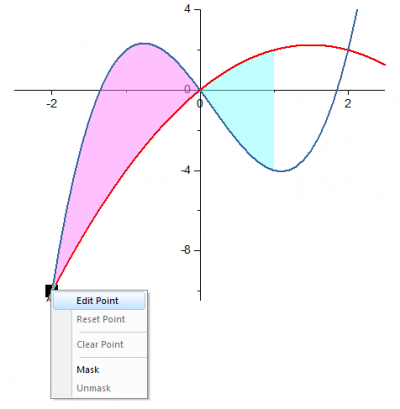
- In the dialog that opens, you will see a special point showing its row index has been added and selected under the second plot.
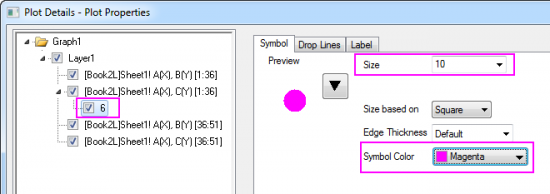
- Go to the Symbol tab, customize its style as below:
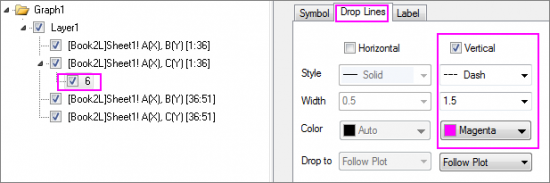
- Go to the Drop Line tab, enable the vertical drop line and set its style as shown below:
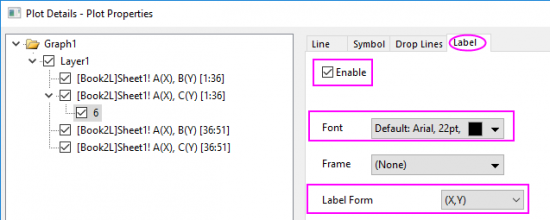
- Go to the Label tab, check the Enable check box to set Label Form to (X,Y) and Font Size to 22
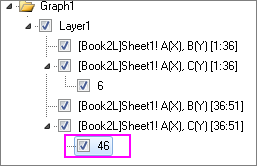
- Click OK to turn off this dialog. Do the similar steps as step 1 to add another intersection at X=2(row index = 46).
And then, set the same styles for it. At the end, you will get the graph such as the one shown below:
Adding Function Formulas and Axis Arrows
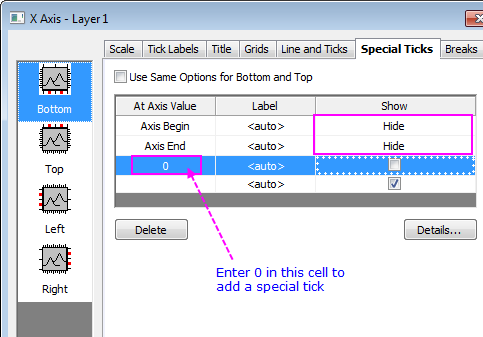
- To hide the axis tick labels at (0,0), open the Axis dialog again and go to Special Ticks tab, then for the Bottom icon set as below and do the same for the Left icon.
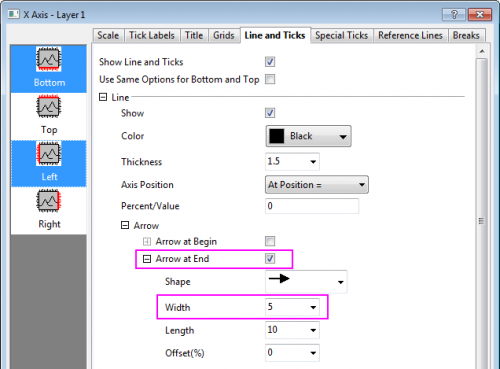
- To add arrows to the ends of the axes. Go to the Line and Ticks tab of Axis dialog. Select both Bottom and Left icon in the left panel of the Axis dialog. Expand Arrow node, check the Arrow at End checkbox, and then set Width to 5.
- Double-click on X axis to open the Axis dialog. Go to Reference Lines tab, enter 1 in the Reference Lines at Value text box, then click any place in the list table to add a reference line at X=1. Do the settings as below:
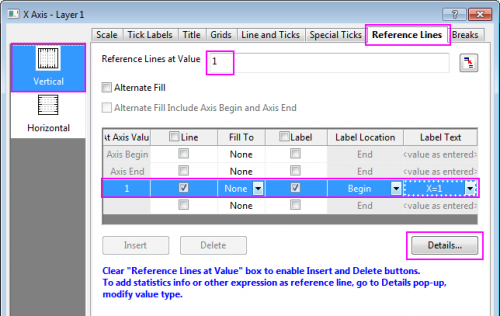
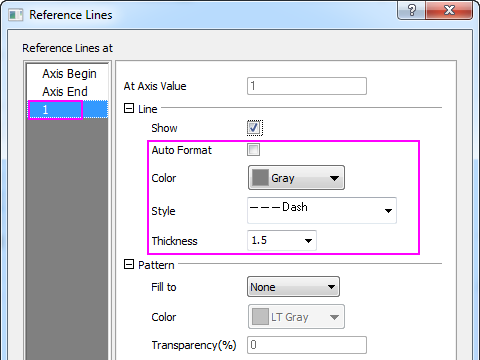
Click the Details button to set the line style.
Click OK to close this dialog, and then click OK button to apply the settings and close the Axis dialog too.
| You can also use the Add Straight Line tool(opened by selecting Insert: Straight Line menu) to add such a vertical straight line at X=1.
|
- To add the two curves' formulas to the graph, right-click on a blank area and choose Add Text.... Type any character into the object to create a text object firstly. And then right-click on it to select Properties from the context menu to open the Object Properties dialog. Enter the first formula in the Text tab.
y=-x\+(2)+3x
y=2x\+(3)-x\+(2)-5x
- Click OK button to close the dialog. Add one more text object and open Text Properties dialog again to enter the second formula above in Text tab. Click OK button again, then these two formulas have been added to the graph window both. Reposition them as needed.
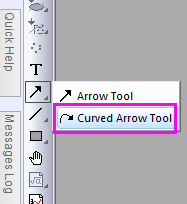
- Select the Curved Arrow Tool and add two curved arrows to connect formula labels to line plots.
- Your final graph should look something like this:

Generating Function Data using Set Values tool
- Open a new workbook. Choose Add New Columns to the worksheet so there are 3 columns.
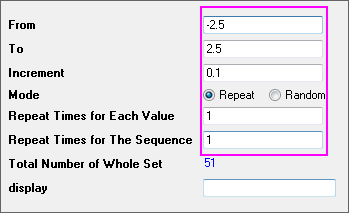
- Right-click Col(A) and select Fill Column with: A set of Numbers...
- In the patternN dialog box, set up the following parameters:
- Double-click on the F(x) label row of Col(B) to turn to the in-place edit mode, then enter -1*A^2+3*A as below.
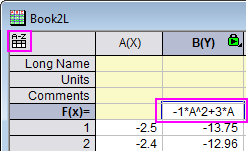
| Note: Since Origin 2017, a new control Spreadsheet Cell Notation has been added and turned on by default. Origin supports use of column Short Name as notation in column formula, such as A+1 instead of col(A)+1.
For earlier version, you are supposed to enter -1*col(A)^2+3*col(A) instead.
|
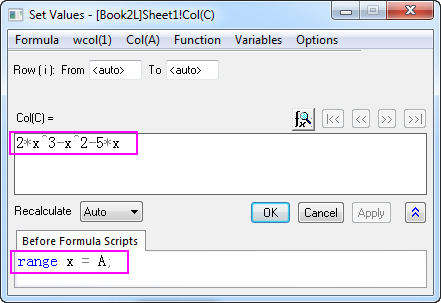
- Highlight col(C) and right-click on it to select Set Column Values from context menu to open Set Values dialog. In this dialog, enter formula and the range definition as below:
|