17.6.3.1 The Weibull Fit Dialog BoxWeibullFit-Dialog 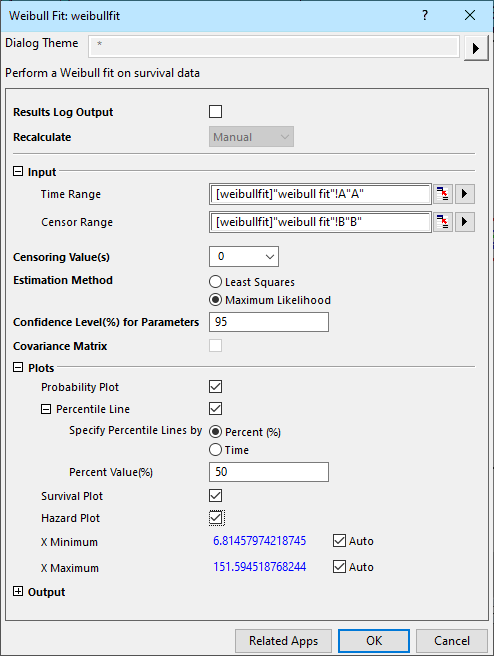
Input
Specify input data range, including time data range and censor data range
| Time Range
|
Specify time data column
|
| Censor Range
|
Specify censor data column
|
Censoring Value(s)
Specify the censor subject value, which identifies which time values in the observation data set are censored.
Estimation Method
Specify the estimation method. Two methods are supported:
Confidence Level(%) for Parameters
Text box to enter a confidence level to be used when computing errors for the survival function and upper and lower limits of the quartile estimates
Covariance Matrix
Select this check box to output covariance matrix. It is only accessible when Estimation Method is set to Least Squares.
Plots
Specify the plot types to be exported in the result sheet.
Probability Plot
Select to include a Weibull probability plot in the result worksheet.
Percentile Line
Available only when Probability Plot is selected. Select this checkbox to add percentile lines to probability plot.
| Specify Percentile Lines by
|
Specify the type of percentile lines.
- Specify percentile lines by percentage.
Specify percentile lines by time.
|
| Percent Value(%)
|
Specify the percent value when Percent(%) is selected for Specify Percentile Lines by.
|
| Time Value
|
Specify the time value when Time is selected for Specify Percentile Lines by.
|
Survival Plot
Select to include a Weibull survival curve in the result worksheet.
Hazard Plot
Select to include a Weibull hazard curve in the result worksheet.
X Minimum, X Maximum
Auto values are X Minimum = 1 and X Maximum = 99. If Auto is cleared, use the minimum and maximum values of the Reference Line column in the output.
When X Minimum is greater than the Auto value, we calculate Percentile value p1 for the X Minimum, and the Percentile column should only include p1, and values greater than p1, in the default list. If X Maximum is less than the Auto value, we calculate the Percentile value p2 for the X Maximum, and the Percentile column should only include p2, and values less than p2, in the default list.
When X Minimum is less than the Auto value, we calculate the Percentile value p1 for the X Minimum. If p1<1e-5, p1=1e-5, we then find the minimum value 10^(-m) which is larger than p1 and the Percentile column includes p1, 10^(-m), 10^(-m+1), ,,,,1, 2,...
If X Maximum is greater than the Auto value, we calculate the Percentile value p2 for the X Maximum. If p2>99.99, p2=99.99, we then find the maximum value which is less than p2 from the list (99.9, 99.99) and the Percentile column includes 99, 99.5, 99.9,..p2.
Output
Output Results
Specify the report worksheet destination.
Plot Data
Specify the destination of the plot data.
Results Log Output
If this check box is checked, the result will be output to Results log.
Recalculate
Refer to this page.
|