17.6.1 Kaplan-Meier EstimatorKaplanMeier-Estimator
Introduction
Survival analysis is the study of the time until a certain event, such as a death in treatment. The time until the event is known as the survival time. For a member of the study group, if the event occurs during the study period, the survival time represents complete data. Otherwise, if the event does not happen in a particular member, the survival time is called censored time.
The survival rate can be described as a survival function, S(t), from the sample survival time. A survival function, S(t), is the probability of surviving until at least time t with S(t)=1-F(t), where F(t) is the cumulative distribution function of the failure times. Since there are censored values, which means an incomplete observation, special methods should be introduced to estimate S(t). The KaplanMeier or product-limit estimator provides an estimate of S(t), from a sample of failure times which may be progressively right-censored. from a sample of failure times which may be progressively right-censored.
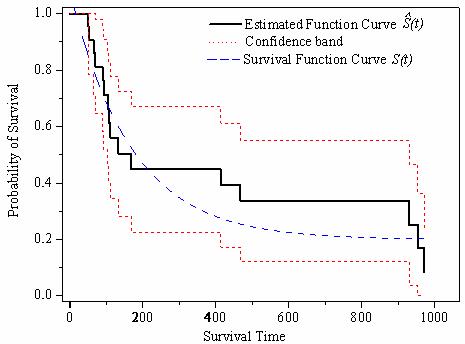
The estimated survival function, , is a step function. As the sample size increases, the curve will get closer to the true curve, S(t).
Besides the survival curve, Origin also calculates the upper and lower confidence limits and quartile estimation.
Handling Missing Values
If there are missing values in the Time/Censor/Grouping range, the whole case will be excluded in the analysis
In the previous version before Origin 2015, missing values in the grouping range will be considered as a group.
Performing Kaplan-Meier Estimator
To compute the Kaplan-Meier Estimator:
- Select Statistics: Survival Analysis: Kaplan-Meier Estimator. This opens the kaplanmeier dialog box.
- Specify the Input Data, including Time Range and Censor Range and optionally group variable. You can also specify several survival tables, such as summary table for event and censor values, a table for survival estimates, quartile estimates and mean estimates. When a grouping variable exists, you can produce equality tests for the survival functions, including Log-Rank, Breslow and Tarone-Ware methods.
- Upon clicking OK, an analysis report sheet is generated to show the desired tables.
Associated documentation: nag_prod_limit_surviv_fn (g12aac).
|
Topics covered in this section:
|
|