27.1.2.3 Saving Formats to a ThemeThemeRef-SaveFormat
The Save Format as Theme dialog can be used to save a set of properties of the graph or the graph object to a theme file which can then be applied to other graphs. The dialog can be opened by right clicking on a graph or a graph object (the graph title, legend etc.) and then selecting the Save Format as Theme option.
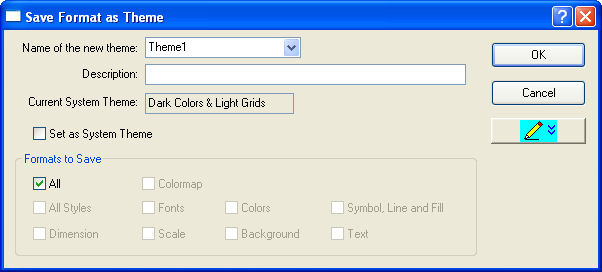
The Saving Format as a Theme Dialog
| Name of the new theme
|
Specify a name for the new theme file or select a theme from the drop-down list. All the themes in the Theme Organizer will be listed here.
|
| Description
|
The text entered in this box will be shown as a tip when your mouse hovers over the name of the theme in the Theme Organizer.
|
| Current System Theme
|
This non-editable text box shows the name of the current System Theme.
|
| Set as System Theme
|
Select this box to set the Theme file as your System Theme.
|
| Formats to Save
|
The collection of check boxes in this group can be used to determine the kinds of style formats to be saved to the new theme files. The default is All, which will lead to saving all object properties. If you clear All, you can then select just one or several kinds of formats to be saved, such as colormap, fonts, colors, text, etc.
|
| OK
|
Save the new Theme file and close the dialog.
|
| Cancel
|
Click Cancel to close the dialog without saving the Theme file.
|
| Edit Theme Details
|
Edit the theme file in details. For more details, please refer to Edit Theme Details below.
|
| Cancel Edit
|
It is available only when the Edit Theme Details button has been clicked. Click this button to discard any changes that were made to the Theme and switch the dialog to the simple mode.
|
| Filters
|
Click this button to bring up the Theme Properties Filtering dialog box to edit/modify the Theme using filters. For more details about this dialog, please refer to Theme Properties Filtering.
|
| List View
|
Select this checkbox to show the properties in List View.
|
Edit Theme Details
You can click the Edit Theme Details button (  ) to expand the Save Format as Theme dialog and edit the theme in details. Once the button has been clicked, it will become the Cancel Edit button ( ) to expand the Save Format as Theme dialog and edit the theme in details. Once the button has been clicked, it will become the Cancel Edit button (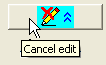 ). The following is the expanded Saving Format as Theme dialog. ). The following is the expanded Saving Format as Theme dialog.
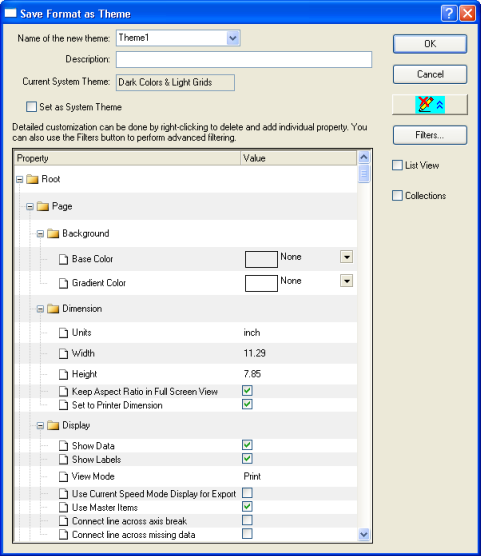
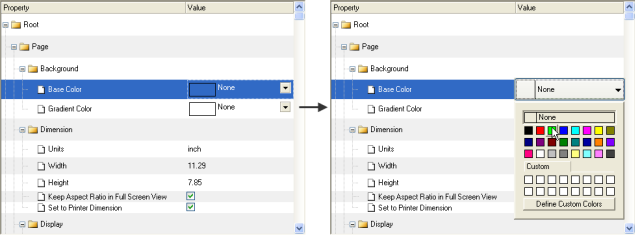
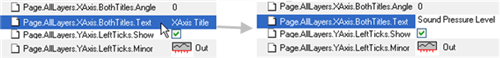
In the lower panel, the Theme properties are displayed in a tree view. You can edit any property by clicking on the Value column and then
- select a value from the drop-down list.
- select or clear a check box.
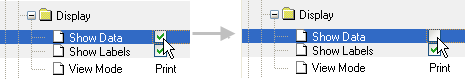
- edit in the text box.
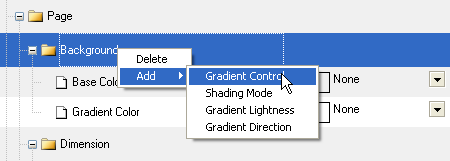
You can right-click on a property or a branch of the tree, and then choose Delete from shortcut menu to delete it. You can also right-click on the icon of a folder (the "tree node") to select the Add from the context menu to add more properties/branches to the tree.
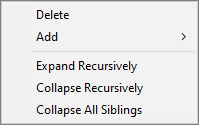
 | To simplify or show a more detailed view of properties, use the shortcut menu to expand or collapse the selected nodes, subnodes and sibling nodes.
|
Save Format for Single Object
When saving format as a theme, the theme nodes are by default consolidated, which means the layers, plots, axes .etc are globally controlled. This behavior is associated with the setting of system variable @TCT, the default value of which is 75 , indicating the consolidation is on.
In order to make sure the saved format theme only applies to the selected object, you can turn off the theme nodes consolidation by setting the system variable @TCT to 0.
(Note: the minimum version of this method is Origin 9.0 SR0, in previous versions, set @TCT=101 to get similar effect.)

|
This mini tutorial will show you how the theme nodes consolidation control works.
- Click the Import Single ASCII button
 to import the Linked Layer 1.dat file under <Origin Folder>\Samples\Graphing path. to import the Linked Layer 1.dat file under <Origin Folder>\Samples\Graphing path.
- Highlight column B and click the
 button on the 2D Graphs toolbar to create a line plot as Graph 1, do the same for column C and D respectively. So that there are three graphs(Graph 1, 2 and 3). button on the 2D Graphs toolbar to create a line plot as Graph 1, do the same for column C and D respectively. So that there are three graphs(Graph 1, 2 and 3).
- Open the Command Window(if not opened, press Alt+3 to open it), and type @TCT=; and press Enter, check that the value of the system variable is the default value 75, which means the theme node consolidation is on.(In case it was changed previously, run @TCT=75; to set the value as default).
- Activate Graph 1 and select the Y axis title Lead, change the font color to Red, right click on the object and choose Save Format as Theme, first make sure the edit theme details mode is off and in the Formats to Save branch, clear the check box before All and select only for Color. Save this theme with name EX1 and click OK.
- Go back to the Command Window, run the command @TCT=0 to turn off the theme nodes consolidation.
- Right click the Y axis title of Graph 1 and choose Save Format as Theme, in the Formats to Save branch, clear the check box before All and select only for Color . Save this theme as EX2.
- Activate Graph 2 and press F7 to open the Theme Organizer, in the Graph tab, select the user theme EX1 and apply to the current graph (Graph 2). Note that everything in this graph changes to be red.
- Activate Graph 3, similarly open the Theme Organizer and apply the theme EX2, note that only the Y axis title is changed to be red, as the theme EX2 was saved when theme nodes consolidation is off.
|
|