21.1 NetCDF ImportingNetCDF-Importing
In Origin, we support NetCDF Connector to import and partial import
GIS, Import
Import NetCDF
NetCDF file can only be imported into workbook/matrixbook. When you import .nc file, make sure workbook window or matrix window is active.
NetCDF file location
To import a .nc file on local PC or network
- To import a .nc file on local PC or network:
- Drag .nc file from Windows Explorer into Origin workspace, Workbook or Matrix.
or
- Choose Data: Connect to File: NetCDF... menu to pick the .nc file and click OK.
- Data Connector Brower dialog opens.
To import a .nc data on web
- Choose Data: Connect to Web.
- In the Connect to Web dialog, set File Type to NetCDF (optional) and enter URL link (e.g. https://psl.noaa.gov/thredds/fileServer/Datasets/cpc_us_precip/precip.V1.0.1948.nc), or click Recent URLs if you have down import in the past. Then click OK.
- Data Connector Brower dialog opens.
Data Connector Browser
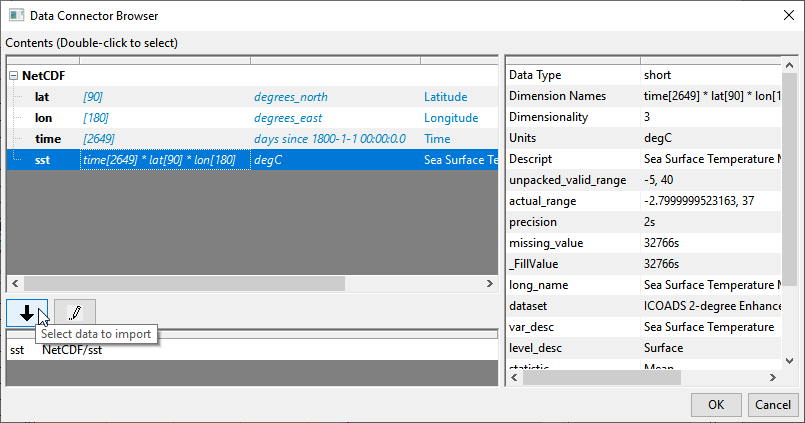
In the Data Connector Brower dialog, all variables list on the left panel with basic info. Origin only supports importing one variable at a time.
Click variable on the left to view extra info. on the right panel. E.g. sst (in above image of first section) is a 3 dimensional data.
- Double click or click the down arrow button to add it to the bottom panel.
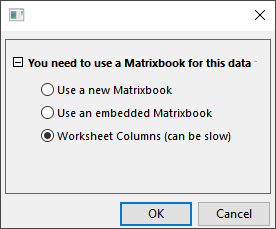
- If a Workbook is active and the file can be imported to either Matrix or Workbook, a dialog will popup for you to choose
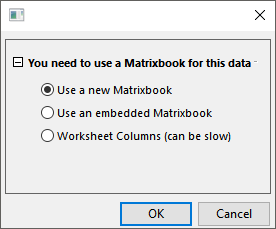
- Use a new Matrixbook: this is the most straightforward way.
- Use an embedded Matrixbook : this will import data into matrix but the Matrix is embedded as a sheet in Workbook.
- Worksheet Columns (can be slow) : this will import each time frame of Matrix into multiple columns so it can create a Worksheet with many many columns and cause slowness if data is big.
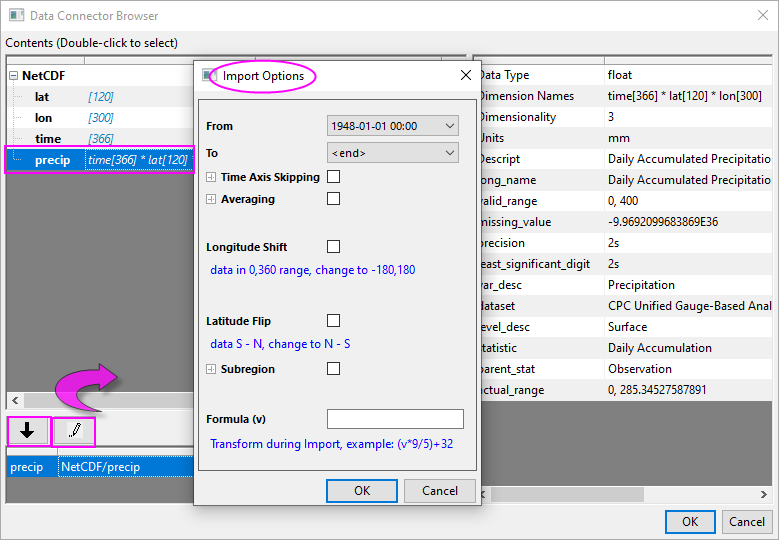
- Click the Import Options button (the "pencil" icon) and choose your options. Here, you can specify a partial import, convert longitude or flip your Matrix vertically, or transform data using a formula.
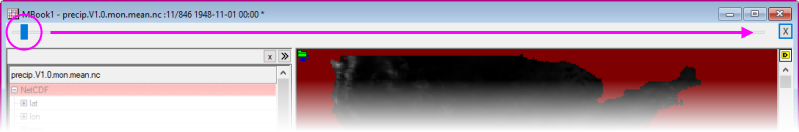
- Click OK to close Import Options and click OK again to close the Browser and import your data. Large files may take some time to import. When the file is imported a Browser panel is added to the left side of the Matrix or Workbook.
- If import to a Matrix, the slider at the top of the matrix window for viewing individual matrix objects.
- If import to a Workbook, all columns are imported into a sheet.
More Import options
Connector icon
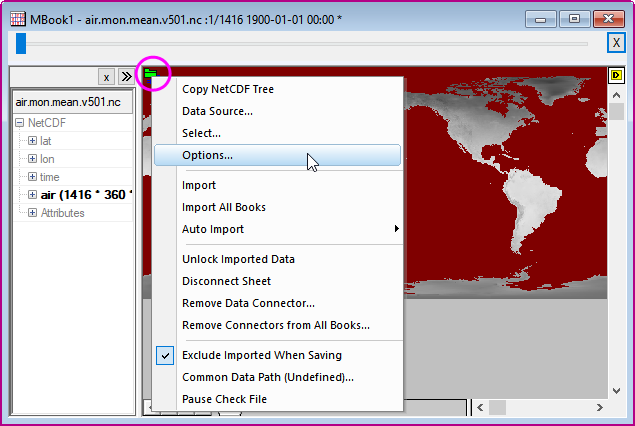
After importing, the Connector icon  is shown on the top-left corner of the Workbook or Matrix. is shown on the top-left corner of the Workbook or Matrix.
Clicking on the Connector icon:
- Choose Select... to change to import another data. It will replace the previously imported data.
- Make changes to Import Options by choosing Options.
Browser panel
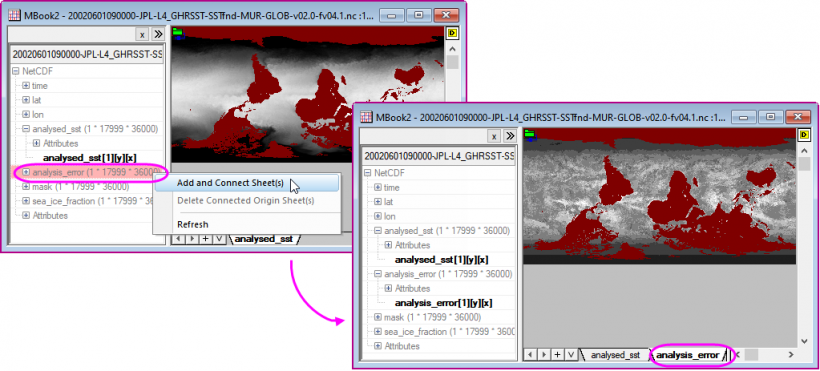
In the left side Browser panel, it lists all the variable in this .nc file. And you can right-click on other variables to add them.
- Add and Connect Sheet(s): Add the selected variable in a new sheet of the Workbook/Matrix.
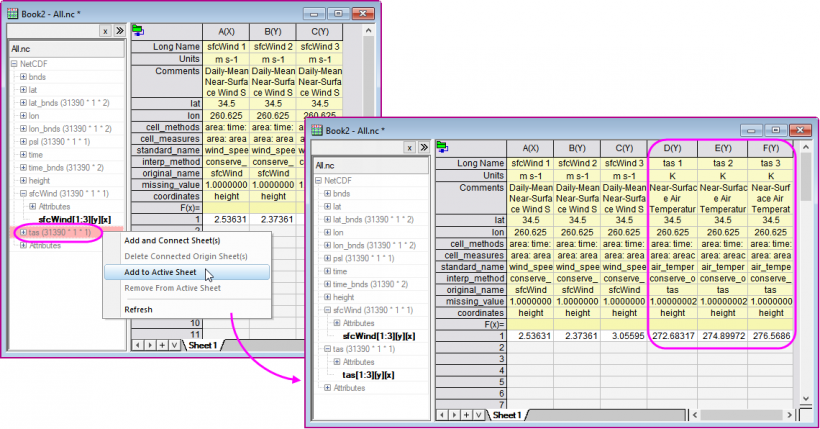
- Add to Active sheet:This option is only available in importing into WorkBook. Add the selected variable to new columns in the active Worksheet.
Import NetCDF with different Dimensional Variable
Import 1 Dimensional Variable
lat, lon and time, level, etc. are 1 dimensional data. They can be imported into Workbook or Matrix.
Note:
Importing 1 dimensional data when the Workbook window active, the dialog for selecting Workbook or Matrix does not pop up. Origin will auto detect it is a single cell data and import it into worksheet column.
- With Workbook window active, choose Data: Connect to File in the menu and pick a .nc file.
- In the Data Connector Brower dialog, double click on a variable or click the down arrow to select the variable to import.
- The variable will be put to bottom panel.
- Click OK to import.
- Click the Data Connector icon and click Select... to change to import another 1 dimensional data. It will replace the previously imported data.
- All variables are listed on left panel of the workbook. Click on any other 1 dimensional data, right click and choose Add to active sheet to add it to current sheet.
Or choose Add and connect sheets to import the selected variable to a new sheet in same book.
Import 2 Dimensional Variable
lat*lon, etc. are 2 dimensional data. They can be imported into Workbook or Matrix.
- With Matrix window active, choose Data: Connect to File in the menu and pick a .nc file.
- Pick a double click on a 2 dimensional variable or click the down arrow to select the variable to import.
- Choose Use a new MatrixBook to import it
- The variable will be put to bottom panel.
- Click OK to import.
- Click the Data Connector icon and click Select... to change to import another 2 dimensional data. It will replace the previously imported data.
- All variables are listed on left panel of the workbook. Click on any other 2 dimensional data, right click and choose Add and connect sheets to import the selected variable to a new sheet in same book.
Import 3 Dimensional Variable
The 3 dimensional data can be imported into Workbook or Matrix.
- Choose Data: Connect to File in the menu and pick a .nc file. Like sst in above image of first section is a 3 dimensional variable (e.g. time * lat * lon)
- Double click or click the down arrow button to add it to the bottom panel.
- Choose Use a new MatrixBook to import it
- The variable will be listed at the bottom panel.
- Click OK to import.
Import 4 Dimensional Variable
The 4 dimensional data can be imported into Workbook or Matrix.
- If the variable's Dimensionality is 4, (e.g. time[248] * level[18] * lat[180] * lon[360]) and choose Use a new MatrixBook to import it. By default, Origin will pick the first level to import. A matrix book with one matrix sheet will be created for that level and the level value will show as matrix sheet name, each time frame will show on one matrix object. You can drag the slider on top of matrix sheet to view all imported time frames.
- Click the the Connector icon and choose Select.. to view the connection string (e.g. NetCDF/t[z][10][y][x]. indicating that level 10 was imported).
- It supports import multiple levels as Matrix sheets. For example, you can modify it to be NetCDF/t[z][2:5][y][x] to import the levels from 2 to 5.
To import all levels into matrix, the string can be modified to NetCDF/t[z][1:0][y][x] or NetCDF/t[z][s][y][x]
- Use the following LabTalk script to import all 18 levels of data into one matrix book, each level on one matrix sheet.
newbook mat:=1 sheet:=18; //create a matrix book with 20 sheets.
string fname$="c:\tmp\mynetCDF\aa.nc"; //specify filename
wbook.dc.add("netCDF"); //add netCDF connector to the matrix book
loop(i, 1, 18)
{
   page.active=i; //activate ith sheet
   wks.dc.source$=fname$; //specify source file of the connector to the active sheet
   wks.dc.sel$="NetCDF/t[z][$(i)][y][x]"; //specify which level to import
   wks.dc.import(); //import
}
 | When using Data Connector to import NetCDF variable into a matrix as 4D, the structure protection will prevent sheet modification. That means not allow insert/delete/add sheet in this matrix or drag sheet out into new book.
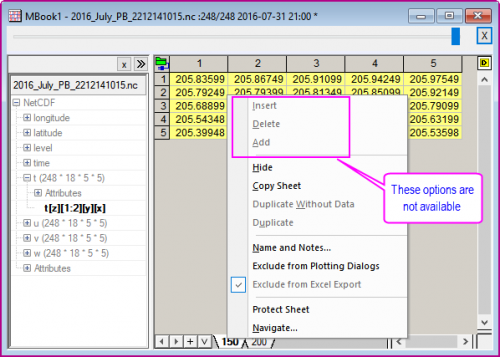
|
Import a Pixel Value in 3D/4D variable into Worksheet Column
Origin supports importing a single pixel value e.g. on certain latitude and longitude of all time frames into a worksheet column.
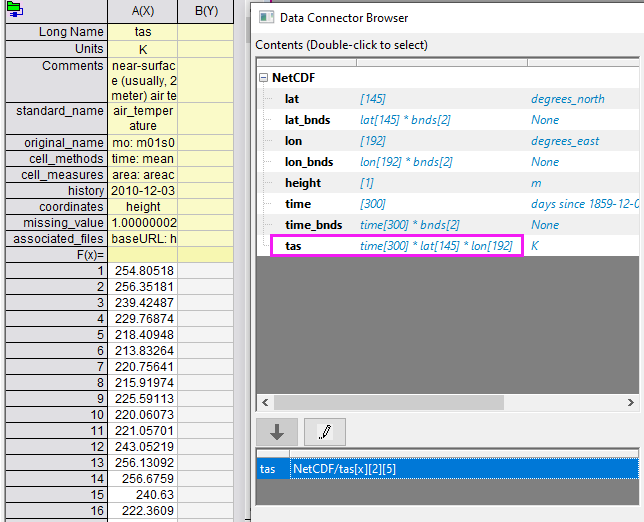
For example if youu have a 3D variable tas of time[300]*lat[145]*lon[192] and you want to import the value at 2nd latitude and 5th longitude of all time frames into a column.
- With workbook window active, open netCDF data connector and choose the .nc file.
- In Data Connector Browser dialog, double click variable tas
- In the prompt that shows, choose the 3rd option Worksheet Columns (can be slow).
- Then in bottom panel, add [x][2][5] and click OK.
- Then in the left panel of workbook, click time variable. Right click it and choose Add to active Sheet to add time column in same sheet. Set time column as X and tas as Y so you can do further analysis an plotting.
- Note: For 4D variable time[300]*level[20]*lat[145]*lon[192], e.g. need to add [x][1][2][5] to import pixel values at 2nd latitude, 5th longitude of level1 in all time frames to a column.
Partial import NetCDF
Specify the time range for importing data
In the Data Connector Brower, after select the importing dataset, you can click on the Import Option - Slicing, Averaging, Formular button  to open the Import Option dialog. to open the Import Option dialog.
- From & To: data-time range to import.
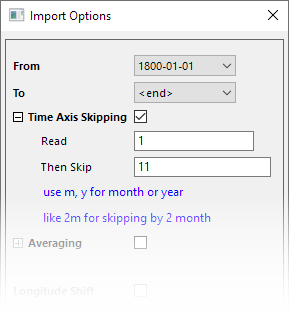
- Time Axis Skipping: Read m records and skip n records and repeat.
- For example, if data is monthly, Read = 1 and Skip = 11 would repeat the pattern of read one month and skip 11 for the entire date-time range.
Calculate annual/monthly average during import
In the importing process, you can import the annual/monthly average directly. Averaging option perform an average based on an Interval and either Sampling by Across Years or Consecutive.
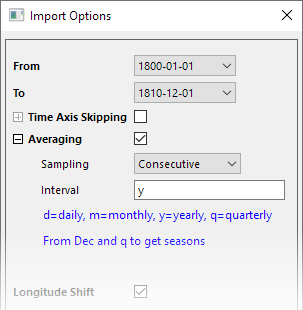
In the Import Option dialog, expand the Averaging section to set it.
| Sampling
|
- Consecutive: Calculate an average for consecutives time. For example, There is a dataset with 5 years. Set Interval = y, which means continuous 12 months. So that it is get 5 matrixes with annual average value.
- Across Years: Calculate an average for the same month across the year. For example, There is a dataset with 5 years. Set Interval = m, then it get 12 matrixes and each matrix is the average value of the five years in the current month.
|
| Interval
|
Enter numeric to indicate consecutive months.
Enter letter: d=daily, m=monthly, y=yearly, q=quarterly
|
Here, we use two samples to show how use Time Axis Skipping and Averaging options to import the average of yearly data in specified months.
Sample 1: Import the average value of 3 months (April, May and June) of each year (from 1900 to 1903)
Sample 2: Import the average value of 4 years (from 1900 to 1903) in April, May and June three months
| - From 2023b, when import consecutive daily average for a range data, e.g. 2022-10-01 1:00 - 2022-10:01: 23:00, we will show the matrix name only with date skipping time part yyyy-mm-dd, like 2022-10-01.
- Also, for consecutive yearly average, the matrix name will be shown with year, like 2022. If you want to disable this setting, you can run the system variable @MOL = 1.
|
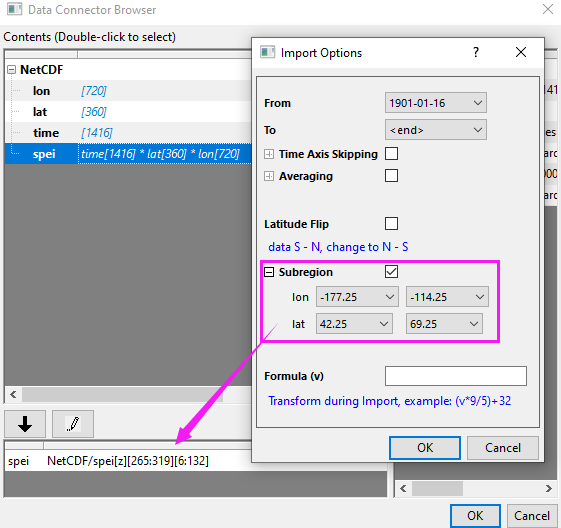
Subregion to Import
In the Import Option dialog, expand the Subregion section to specify the importing region part with longitude and latitude, corresponding index of latitude and longitude will be found and used in connection string.
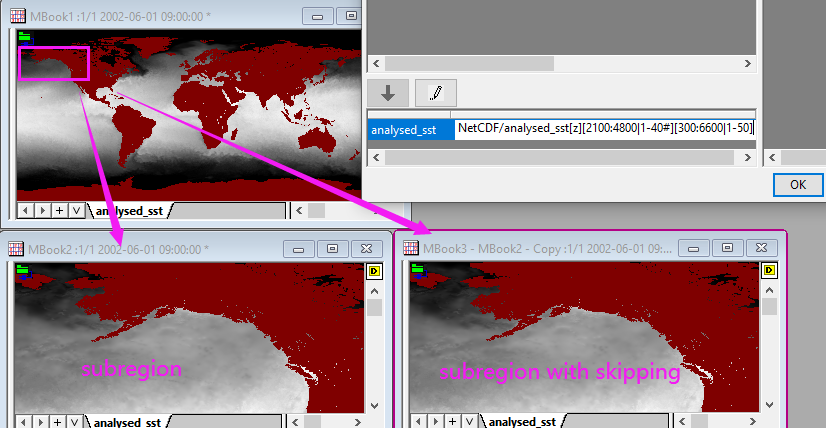
For large data, user can also do subregion + skip every N rows or columns. E.g. NetCDF/analysed_sst[z][2100:4800|1-40#][300:6600|1-50], means for for latitude from index 2100 to 4800, import 1, skip 40, # means latitude flipped, for longitude from index 300 to 6600, import 1 and skip 50.
Longitude Shift
If the longitude is in approximately (0, 360) range, check this checkbox. Longitude will be shifted to (-180, 180).
Latitude Flip
By default, the imported data is from south to north. Select this checkbox to change latitude to from north to south.
Formula
In the importing process, you can calculate new value in the matrix by formula.
For example, if you want to convert imported temperature data from Celsius to Fahrenheit, you can enter this formula in this edited box. v represent the original imported matrix cell value.
(v*9/5)+32
Connection String
Once you've set import options and closed the dialog, the connection string at the bottom of the left side will be updated to show the syntax we used to customize the import. You can directly double click on the string to edit/modify it.
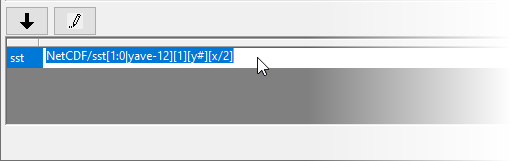
While the connection string syntax can be complex, it follows the basic form of ...
NetCDF/variable[z][y][x]
... where "variable" is the variable that you are importing, and [z],[y] and [x] specify handling, including partial import, of z, y and x dimension data.
| - We recommend using Import Options dialog to customize import to build the Connection string.
- When import 4D variable, first click the pencil button to customize how to import one level. Then get the string and modify the part between [z] & [y] for level. E.g. modify the loop part in Import 4 Dimensional Variables section. E.g. loop i from 1 to 9, and use wks.dc.sel$="NetCDF/t[1:0|ave-d][$(i*2)][y][x]" to import every other level 2, 4, 6, ..., 18, and instead of importing all frames, import daily average.
|
View Mode
The NetCDF Matrix can be showed in Data Mode and Image Mode. You can modify it by choosing View: Data Mode/ View Mode. When import a new NetCDF file, the Matrix shows in Data Mode or Image Mode that depends on matrix size.
- Generally, the matrix will shows in Image Mode.
- If the matrix dimension (rows*columns) is small, Data Mode will be used instead of Image Mode. System variable @VIM control the minimum number of pixels to set view image on initial import. By default, @VIM=400.
- The selected View Mode is kept , when you reimport a file in the Matrix. This is not affected by the matrix dimension.
|