5.3.1 Matrixsheet Dimensions and XY CoordinatesMats-Dim-XYCoord
You can use the Matrix Dimension and Labels dialog to control the number of rows and columns, the X / Y column and row mapping arrangement, and the X / Y column headers, for all matrix objects in a given matrixsheet. Alternately, you can use the mdim X-Function to set the dimensions and coordinates.
Row and column numbers are positive integers. They determine the number of cells in the matrix. If a matrix is a numeric matrix, you can use this dialog to change the dimensions. However, you cannot change the dimensions for images. To determine whether you have an image matrix or a numeric matrix, look at the layer icon. If a matrix object is an image, its object icon will be  . Otherwise, it will be . Otherwise, it will be  . .
To open the dialog, select Matrix: Set Dimension/Labels from the menu.
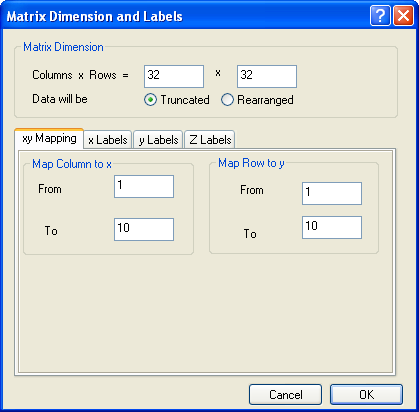
Matrix Dimension
Columns * Rows
Enter the number of columns (X dimension) and rows (Y dimension) in the associated text boxes.
Data will be
For a non-empty matrixsheet, the dimension change will also influence the data. Origin provides two modes to deal with the data in this case, Truncated and Rearranged.
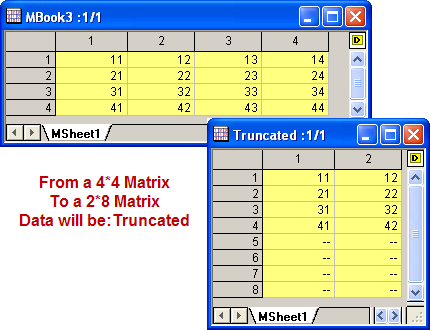
- Truncated
- Only data which exists in the previous dimension range will be kept, other data will be truncated.
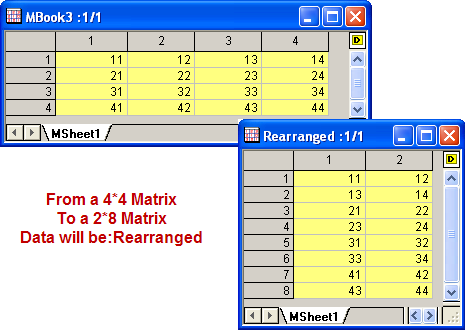
- Rearranged
- All data from the previous dimensions will be rearranged into the new dimension range. With rearranging, the data first forms one array by appending each row of data to the end of the previous row, and uses the data from this array to fill in the new dimension range row by row. If there are extra data points which cannot fit into the new dimension range, they will be truncated. Empty cells in the new dimension range (if any) will be filled with 0.
Coordinates
Type the first and last X / Y values in the associated text boxes under the XY Mapping tab.
The X and Y coordinates of matrix data are assumed to be evenly spaced. The first X is mapped to the first matrix column and the last X is mapped to the last matrix column. The X coordinates of other columns will be linearly mapped. Similar mapping applies to rows, but the first Y and the last Y are used. For a point that corresponds to a matrix cell, its position in 3D space is determined by the X and Y coordinates of this cell, as well as the Z-value that is saved in the cell. When matrix data is plotted or analyzed, it is the XY coordinates, not the column and row numbers, that are used.
Labels
Enter the Long Name, Units, or Comments for X / Y / Z coordinates under the X Labels, Y Labels or Z Labels tab. X / Y /Z Labels can be used as X / Y /Z axis labels in 3D graphs. For detailed information about the Z Labels tab, please refer to matrix object headers.
|