Trellis Plot
Trellis plots or Trellis graphs (also sometimes termed "Trellis displays" or simply "Trellis") are a means of graphing multivariate data, as an array of M X N panels. You can controls the arrangement of horizontal and vertical panels, wrapping panels and mapping color to data plots.
Various types and samples of trellis plots:
Using grouped data, you can create various types of trellis plots in Origin
- Scatter
- Line and Symbol
- Bar
- Column
- Stacked Column/ Bars
- 100% Stacked Column/ Bars
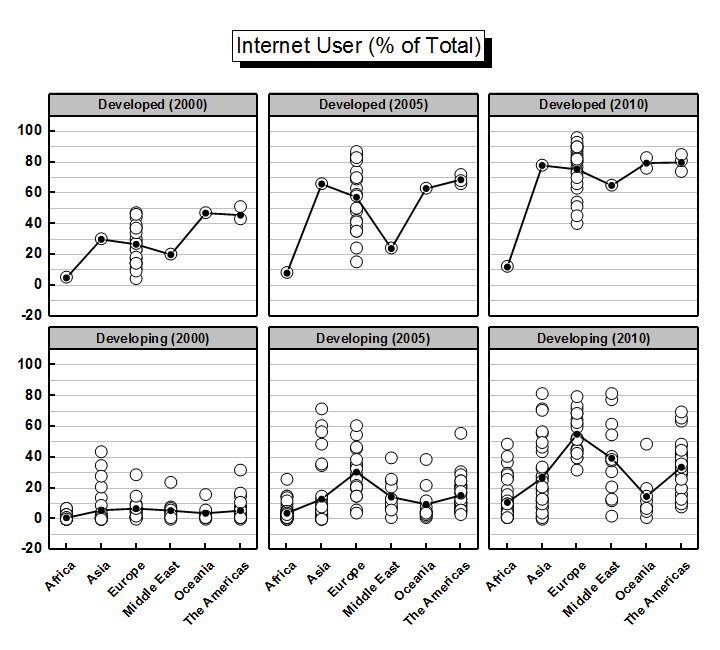
Trellis Scatter with Mean Overlay
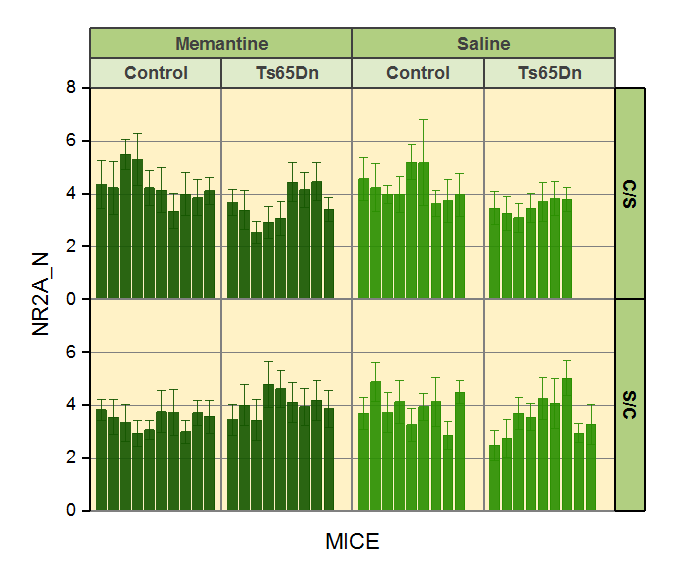
Trellis Column Plot with Error Bar
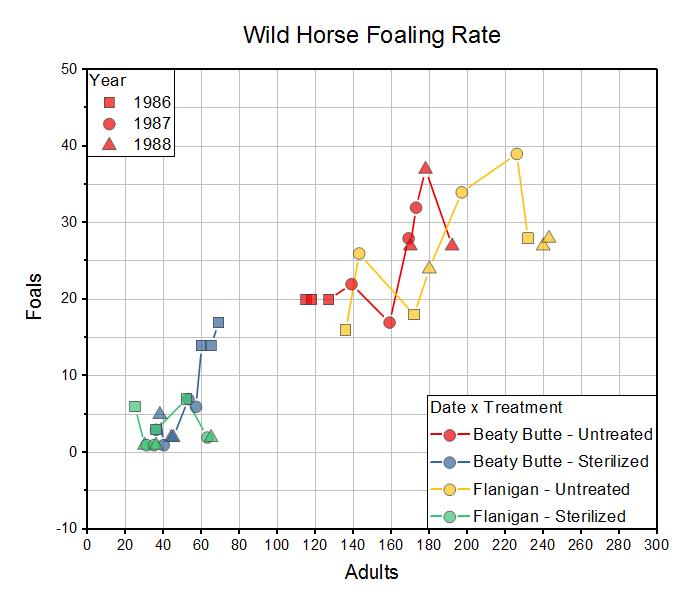
Trellis Overlap Panels with Multiple Categories Combination
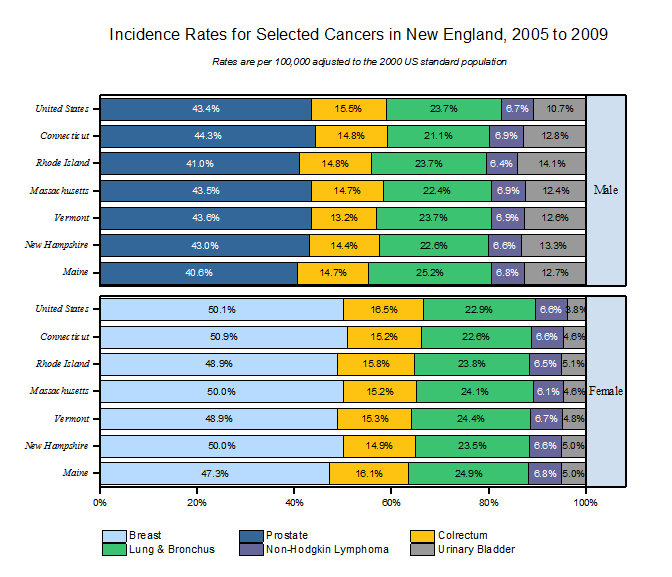
Trellis Plots 100% Stacked Bars