5.3.6 Three-Way ANOVAThreeWay-ANOVA
Summary
Three-way ANOVA tests for main effects, and interaction effects between all combinations of three factors, on a dependent variable.
Minimum Origin Version Required: OriginPro 2016 SR0
What you will learn
- How to carry out three-way ANOVA for practical data with Origin
- How to interpret the generated results
User Story
We have some public data from the World Bank. It includes three factors: Region(Asia/Europe/Africa, etc.), Developing Index (Developing/Developed Country) and Year (2000/2005/2010). We want to understand how these three factors affect the number of internet users and whether there are any significant differences between the groups.
Performing Three-Way ANOVA
- Choose menu Help: Learning Center to open Learning Center dialog. Select Analysis Sample in the left side and then choose Statistics - ANOVA from the Samples in drop-down list in the right side.
- Double-click on third item in the list box to open the folder Three-Way ANOVA(Pro).
- Click on worksheet Sheet1 containing the source data.
- Click Statistics: ANOVA: Three-Way ANOVA
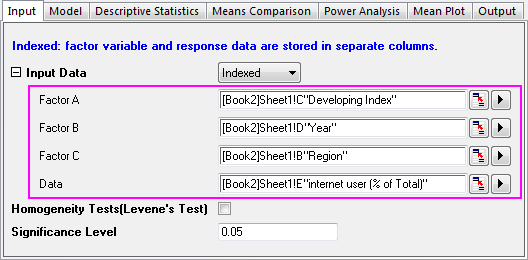
- In the Input tab of the opened dialog, set Input Data as Indexed. Then expand the Input Data branch, select column C,D, B and E for Factor A,Factor B, Factor C and Data, respectively
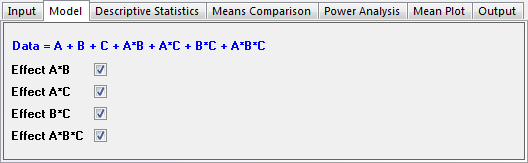
- In the Model tab, make sure all boxes are selected. This determines that a full factorial model will be used for the three-way ANOVA.
- Click OK to apply all setting and close the dialog.
- Go to sheet ANOVA3Way1. The Overall ANOVA table includes ANOVA test results for the main effects and the interactions. If the P Value is less than 0.05, this means the levels in the corresponding factor are significantly different. Note the conclusions in the footnotes beneath the table.
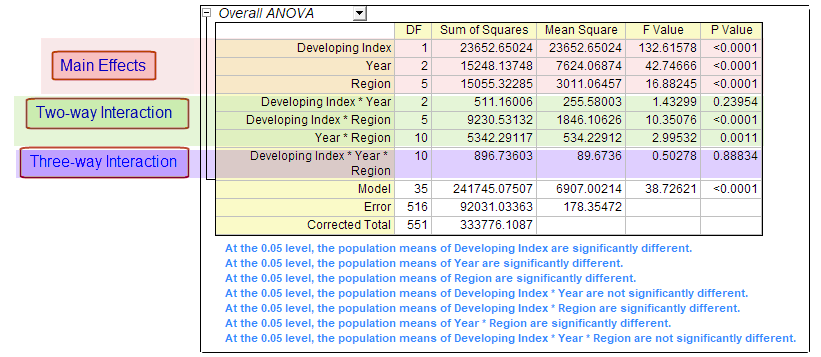 - From the Overall ANOVA table above we can see the two-way interaction of factors Developing Index*Year is not significant (p-value = 0.23954). The three-way interaction of factors Region*Developing Index*Year, is not significant. (p-value = 0.88834).
Examining Significant Interactions
In the following, we are going to further examine factors showing a significant interaction.
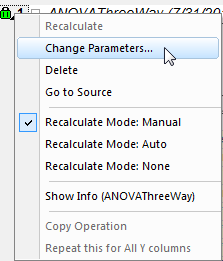
- Click the green lock in the sheet ANOVA3Way1 and choose Change Parameters from the context menu
- In the Model tab, clear the Effect A*B and Effect A*B*C check boxes, where interactions between factors could not detected.
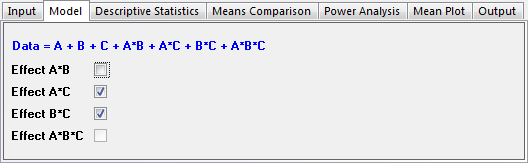
- In the Means Comparison tab, select the Bonferroni check box. Bonferroni is the most commonly used post-hoc test. It controls the overall Type I error.
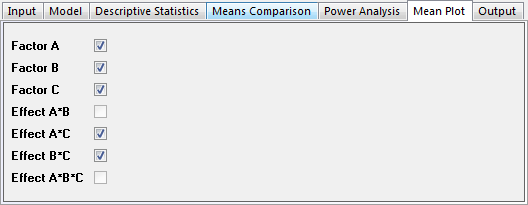
- In the Mean Plot tab, select all available check boxes. (Effect A*B and Effect A*B*C are disabled because they are not included in the model.)
- Click OK to apply all setting and close the dialog.
Interpreting Results
The results in the sheet ANOVA3Way1 are updated using the new calculation parameters.
Overall ANOVA
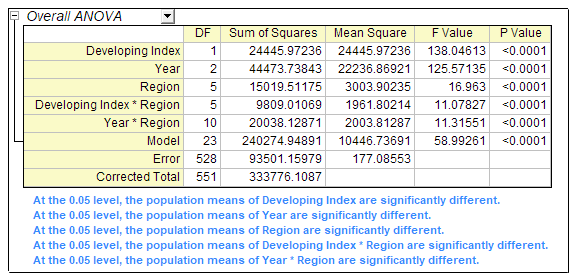
From the table we can see all remaining effects are significantly different. We can use the Means Comparisons results and Means Plots to further detect differences between each group.
Means Comparison and Means Plot of the Three Main Effects
Expanding the branch ANOVA: Means Comparison: Bonferroni Test, you can see the means comparison table for each effect. It is useful, along with the Means Plot at the bottom of the result sheet, for pairwise comparisons between members of a group.
Comparison between Developing and Developed Country
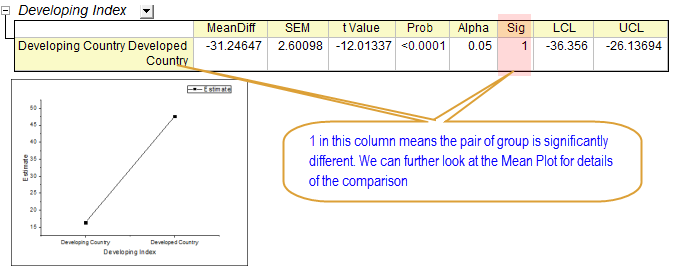
From the result above we can see the number of internet users of developing countries is much fewer than the developed countries.
Comparison between Years
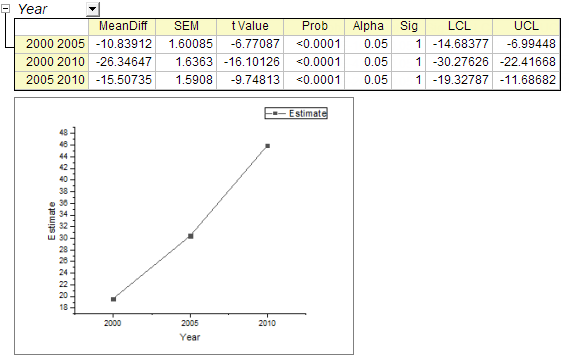
From the result above we can see the number of internet users greatly increased between 2000 and 2010.
Comparison between Regions
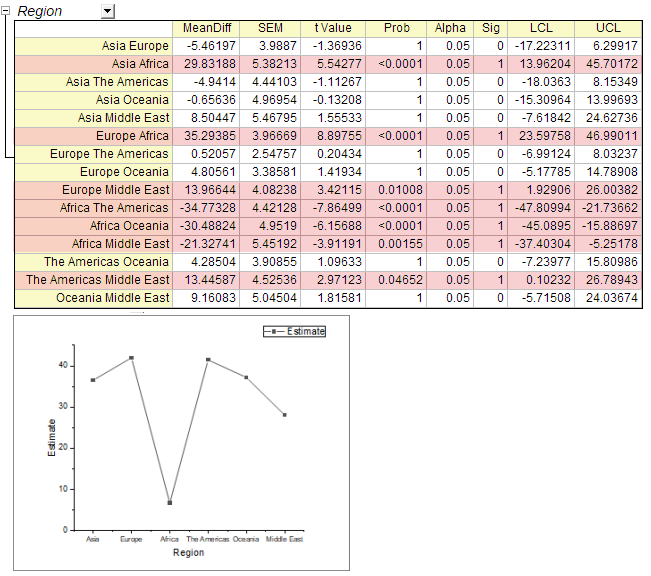
The results above tell us:
- Internet users in Africa are significantly fewer than other continents.
- Internet users in the Middle East are significantly fewer than Europe and the Americas.
- There is no significant difference between other pairs of continents.
Comparing Same Level Between Different Groups
We can compare the sample level between different groups with Mean Comparison results of the interactions. In the following we will show how to use a data filter to quickly view the results we are interested in.
- In the sheet ANOVA3Way1, expand the branch ANOVA: Means Comparison: Bonferroni Test.
- Click the triangle button next to Interactions and choose Create Copy as New Sheet from the context menu.
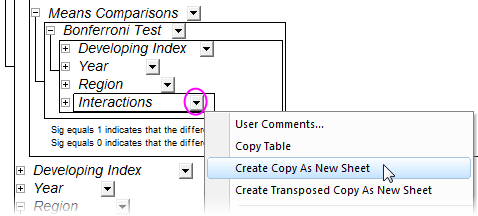
- Go to the generated sheet Interactions. Now we are going to compare developing and developed countries in different regions by applying a data filter in the results.
- Highlight column C, click the Add/Remove Data Filter button
 to add a data filter to the column. to add a data filter to the column.
- Click the Filter icon
 on the column header, choose Custom Filter. on the column header, choose Custom Filter.
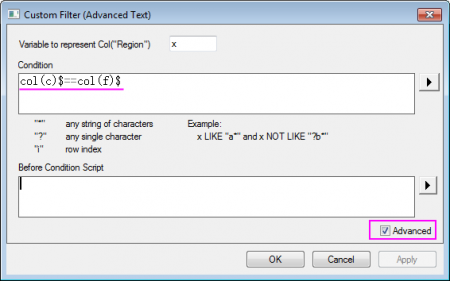
- Select the Advanced check box in the bottom-right corner of the open dialog. Add following script in the Condition box.
col(c)$==col(f)$
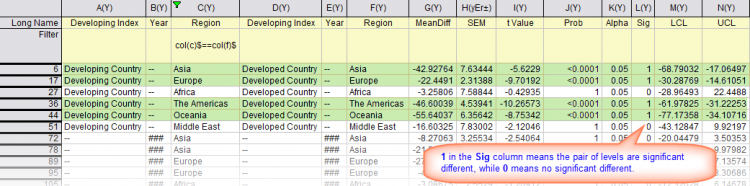
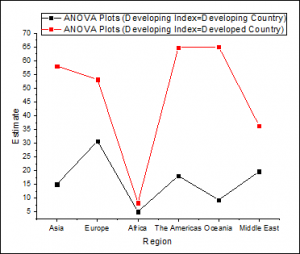
- From the results below we can see:
- The internet users in the developed and developing countries are not significantly different in Africa and Middle East.
- The internet users in the developed countries are significant higher than the developing countries on the following four continents.
| 1. Asia
|
2. Europe
|
3. The Americas
|
4. Oceania
|
|