3.1 Origin GUIOrigin-GUI
Summary
This tutorial will introduce you to the Origin workspace. You will learn about the different kinds of Origin windows that make up a Project, how to manipulate these windows with Project Explorer, how to manipulate layers and plots with Object Manager and how to manage Apps with Apps Gallery.
Minimum Origin Version Required: Origin 2016 SR0
What you will learn
This tutorial will show you how to:
- Manipulate Workbooks
- Create Graph Windows
- Manage workspace with Project Explorer
- Manipulate Layers and Plots with Object Manager
- Manage Apps with Apps Gallery
Origin Application: Title Bar and Status Bar
The Origin Title Bar displays the Origin(Pro) version, any open project name and the current folder within that project (if any) along with the standard Window controls for moving, sizing and closing the window.
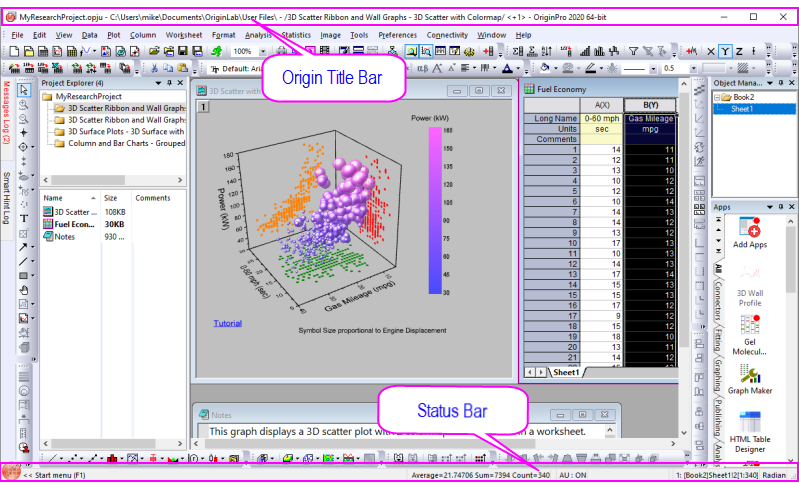
The Status Bar appears at the bottom of the Origin workspace and hosts the Start Menu; plus it displays messages, the state of Auto Update, summary statistics (user-customizable) of currently-selected worksheet cells, Child Window Theme (if any), Last active Workbook, Current Window and Angular Units indicator.
- Customize what shows in the Status Bar by right-clicking on the Bar and selecting (or clearing) items from the context menu.
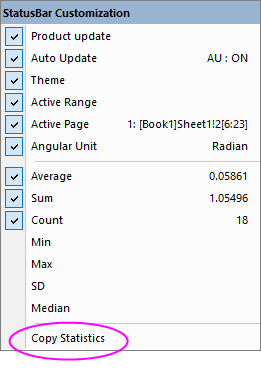
- Copy summary stats by selecting Copy Statistics from the context menu. The copied data are TAB separated between quantity and values, with each key value pair separated by a CRLF delimiter.
 | The Auto Update item on the Status Bar shortcut menu relates to the current state of all auto-updated recalculation operations. Normally, you will see AU: ON on the status bar, indicating that any change to input data will trigger automatic recalculation of output where the Recalculate Mode is set to Auto.

When a large number of such operations slow your work, consider turning Auto Update OFF. When ready, you can turn it back on or trigger manual recalculation of output.
|
Windows
Dynamic menus according to the active child window
The Origin menu dynamically changes according to the active Child Window. Some menus (Help, File, Edit, etc.) appear on all Child Window menus, although their content may change.
- Click on the New Project button
 on the Standard Toolbar. on the Standard Toolbar.
- The workbook window is the active window. Note that there are 13 menu items.
- Click on the New Graph button
 on the Standard Toolbar. A new window called Graph1 is created. Note that there are 11 menu items displayed. on the Standard Toolbar. A new window called Graph1 is created. Note that there are 11 menu items displayed.
Thus, we say that the menus are "context sensitive." They will change depending on which type of Child Window is active.
Note: New Child Windows may be added by selecting the File: New menu option or clicking the appropriate button on the Standard Toolbar. All Child Windows have standard controls for moving and sizing and windows can be placed anywhere within the Origin workspace. The Window menu has options (cascade, tile) for arranging child windows within the workspace. In the central Origin Workspace is where you will find all Origin Child Windows which can include:
Workbooks - The Origin workbook is the primary structure for organizing your data. Each workbook is composed of one or more, up to 255 worksheets.
Graphs - With Origin, you can create over 60 graph types, each from a built-in graph template. Graph windows can be embedded in a worksheet cell.
Matrices - The Origin matrix holds data and images and is required for many 3D graph types.
Notes - Notes windows are a text-only Origin child window useful for recording analysis procedures, making notes to students and colleagues, etc. You can embed notes windows in a worksheet cell.
Layouts and Excel (If you have Excel installed)
Workbook
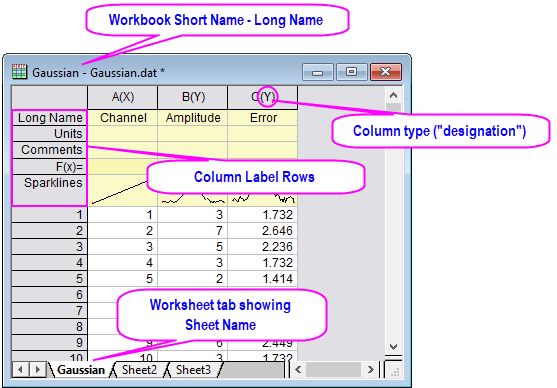
The Origin workbook is the primary structure for organizing your data. Each workbook is composed of one or more Origin worksheets. Each worksheet is generally composed of one or more worksheet columns or datasets. Columns in Origin have different column types ("designations") such as X, Y, Z, yError, etc, These user-configurable designations are used to determine how data should be treated for graphing and analysis purposes.
Origin and OriginPro projects can contain any number of workbooks (limited by system resources). Projects saved with the Student Version are limited to 30 windows total (graph, workbook, matrixbook, etc.).
- The workbook has a Short Name and optionally, a Long Name and Comments.
- The workbook can contain up to 1,024 worksheets.
- The worksheet can contain up to 65,500 columns or 90,000,000 rows.
- Each sheet has a data area and a set of Column Label Rows that can be used to display column metadata.
To get familiar with manipulating Origin workbooks, try the following:
- Click New Workbook button
 to create a new worksheet. to create a new worksheet.
- Select Help: Open Folder: Sample Folder... to open the "Samples" folder. In this folder, open the Curve Fitting subfolder and find the file Gaussian.dat. Drag-and-drop this file into the empty worksheet to import it.
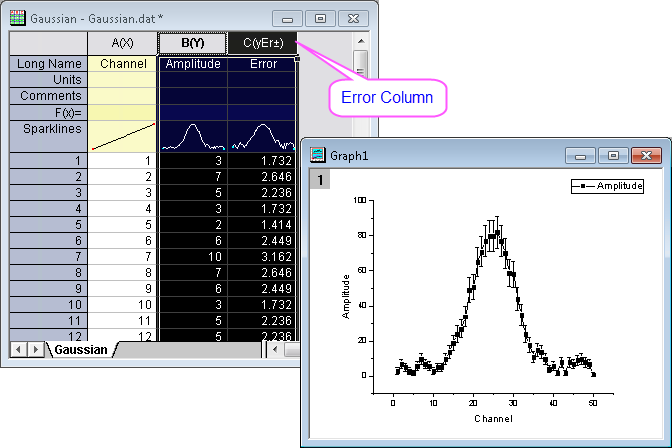
- On import, sparklines were automatically turned on, allowing you to quickly view the shape of the data; the sheet name became the name of the file; and as needed an additional column was added to the worksheet. You can see from the Long Name that the 3rd column represents data error. To set this column as an Error Column, click the column title to highlight the column, right-click to bring up a fly-out menu, and then select Set As: Y Error.
- Plotting data in Origin is now easy; highlight column B and C (Y and Y error), then select Plot > Basic 2D : Scatter from the menu to create a scatter plot with error bar.
| Note: Do not delete this workbook and graph as we will revisit these windows in the section on Mini Toolbars.
|
Graph
The Graph window is a container for graphical depictions of your experimental data and your analysis results. Graph windows may contain a single plot in a single graph layer or they may contain multiple plots in multiple graph layers.
The graph layer is the fundamental unit of the Origin graph. The layer is comprised of a set of axis scale values, one or more data plots, and any included text labels, drawing objects, graph legends/color scales, button objects, etc. Graph layers can be created, sized, and moved independently of one another, allowing you a great deal of latitude in charting your data.
To learn how to organize layers in a graph window, try the following:
- Create a new workbook, and import the file Linear Fit.dat from the \Sample\Curve Fitting folder. You can see that there are three Y columns and one X column after import; each Y column will use the left-most X column as its X coordinates.
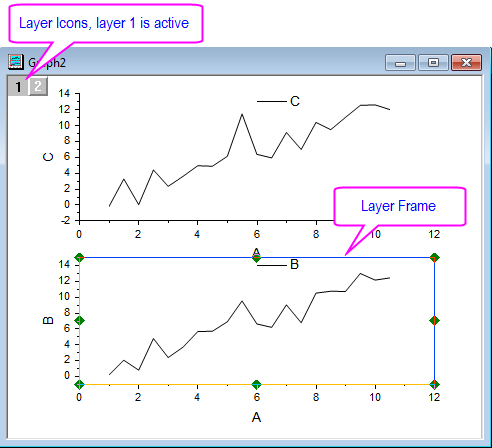
- Highlight columns B and C, and select Plot: Multi-Panel/Axis: Vertical 2 Panel to plot the curves. This is a two layer graph. While a graph can have multiple layers, only one layer is active at any given time. You can perform operations on the active layer, such as resizing, changing the plot color, etc. When working on a layer, the active layer is denoted by a depressed layer n icon in upper left corner of the graph window.
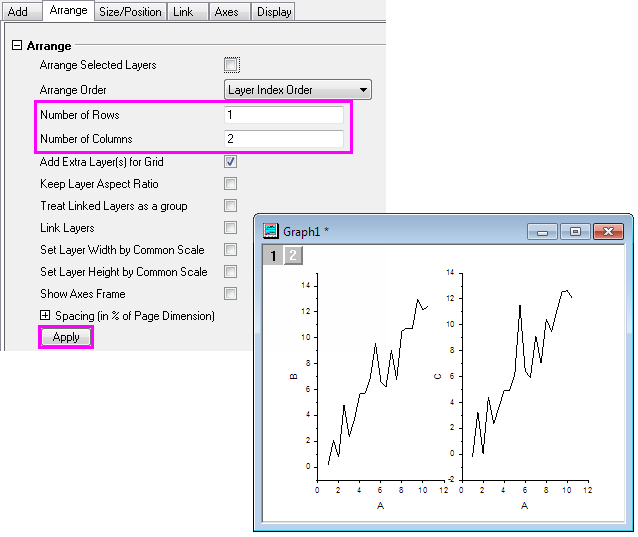
- To rearrange these two layers, with the graph window active, select the menu item Graph: Layer Management to bring up the dialog. Activate the Arrange tab, on the middle panel. Enter 2 in the Column edit box. Enter 1 in the Row edit box and click the Apply button. After you click the OK button, the graph layers are arranged horizontally.
Most often you will use the worksheet for tabulating and manipulating your data, while you will use the graph window for plotting your data.
Matrix
The Origin matrix window is a container for one or more Origin matrices. Each matrix window contains one or more matrixsheets, and each matrixsheet can contain one or more matrix objects. The matrix object itself, is a vector of Z values. These Z values are related to one another in the X and Y dimensions by their relative row and column positions in the matrix. Matrices are a precursor to constructing Origin's 3D graph types such as contour graphs and color-mapped surfaces, and since they are used in depiction and manipulation of 3D data, they are used by Origin in image processing and analysis. We will show you how to use the Origin Matrix to create a 3D plot in a later tutorial.
Toolbars
The Customize Toolbar dialog box handles displaying or hiding toolbars and toolbar buttons.
- Select View: Toolbars from the Origin menu. The Customize Toolbar dialog opens.
- Check the box next to Column. This toolbar now appears in the workspace.
- Make the Button Groups tab active.
- Scroll to select AutoUpdate in the Groups list.
- Click and drag the one button which appears in this group and drop the button next to the green version of this button without the red line, on the Standard Toolbar. You can drag buttons back and forth.
- Click Close.
All these toolbars may be dragged away from their docked positions to become floating windows. Floating windows have additional controls besides the X to hide a window. A push-pin control can allow or prevent docking and a minimize button can roll-up a window to save space and restore the window when it is needed.
Toolbar Reference
Below are the most commonly used toolbars.
Standard Toolbar

Worksheet Data Toolbar
Graph Toolbar

Format Toolbar

Style Toolbar

Tools Toolbar (vertical on the left side of the Origin workspace)

2D Graphs Toolbar

3D and Contour Graphs Toolbar
Mask Toolbar

Mini Toolbars
Mini Toolbars are context-sensitive tools made available for common workbook, graph and matrixbook editing and configuration tasks.
- Create a new workbook, select Help: Open Folder: Sample Folder... to open the "Samples" folder. In this folder, open the Statistics subfolder and find the file automobile.dat. Drag-and-drop this file into the empty worksheet to import it.
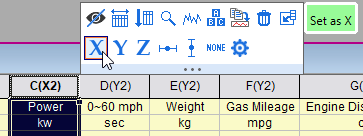
- Click on column header C(Y) to select the column and on the Mini Toolbar, click the Set as X button. Click on the F(Y2) column (Gas Mileage) and click the Scatter button
 on the 2D Graphs toolbar. on the 2D Graphs toolbar.
-
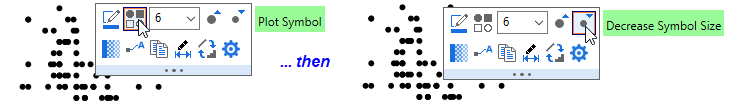
- Click on the data plot of Gas Mileage (mpg) vs Power (kw) and on the Mini Toolbar that appears, click the Plot Symbol button and switch to a round symbol. Click the Decrease Symbol Size button twice to reduce symbol size. If the Mini Toolbar fades before you click this button, press the Shift key to restore the Mini Toolbar.
-
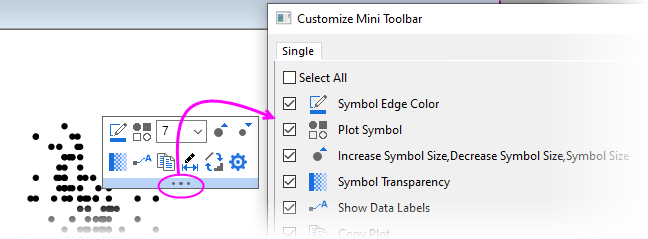
- Finally, click on the data plot again and then click the dots in the lower center of the Mini Toolbar. The Customize Mini Toolbar dialog opens allowing you to add or remove buttons from the active toolbar. You may wish to use this feature if there are buttons on the Mini Toolbar that you never use.
-
Project Explorer
Project Explorer is a tool to help you organize your Origin data. It is particularly useful if you are working with a project that contains numerous child windows. Use Project Explorer to develop a folder structure to organize the child windows in your project.
Open/Close Project Explorer
When you first start Origin, Project Explorer displays docked to the edge of the workspace. You can dock it to any other edge or float it in the workspace. Because Project Explorer uses some of your workspace, you may want to close Project Explorer, even if you have already created a folder structure. To close/open Project Explorer, click the Auto Hide button to pin the Project Explorer, then press Alt + 1 or select menu item View: Project Explorer.
Change the Display Properties of Project Explorer
The project explorer can be auto-hidden, hidden, floating or docking. In another aspect, it has vertical and horizontal alignment.
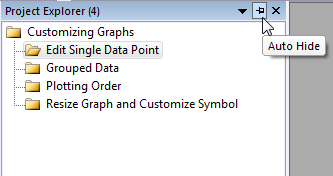
- Select Customizing Graphs.opj in <Origin EXE Folder>\Samples\Graphing folder.
- By default the Project Explorer is auto hidden, move mouse over to the Project Explorer bar in the left of work space to expand it.
- Click the Auto Hide button to pin the Project Explorer, so it will be always displayed.
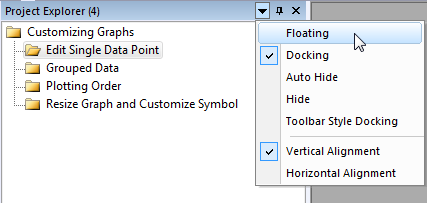
- Select the Window Position drop-down and select Floating to make the Project Explorer float over the work space, and you can freely move its position:
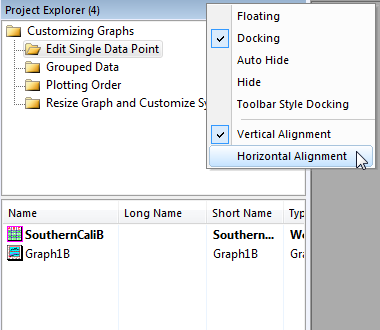
- Right click on the title bar of the floating Project Explorer and select Horizontal Alignment:
Note: Other dockable windows (Object Manager, Apps, Message Log, Smart Hint Log, etc.) have the similar controls to change the display properties.
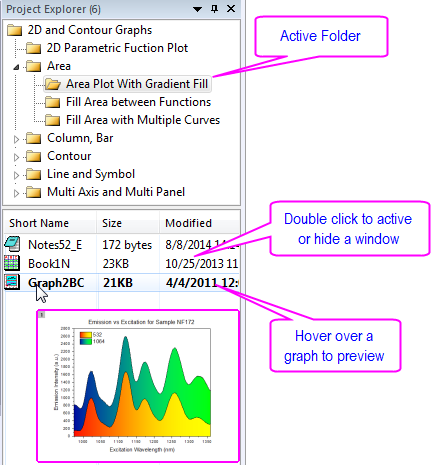
Browse Origin windows in Project Explorer
There are two panels in Project Explorer: the folders panel and the contents panel, which displays all objects in the active folder. When you start a new Origin session, you can click the new workbook  , new graph , new graph  or new matrix or new matrix  button to create some blank windows, and then you can see these window's icons in the contents panel. Double-click the icon to hide/view the window. button to create some blank windows, and then you can see these window's icons in the contents panel. Double-click the icon to hide/view the window.
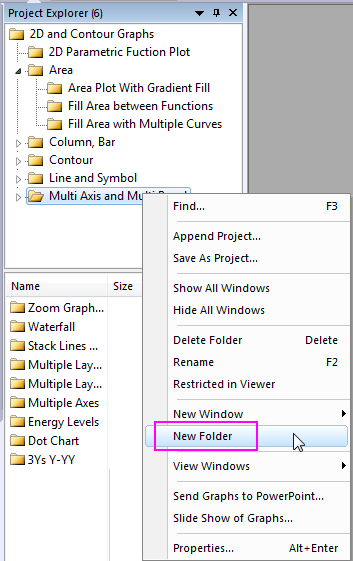
Add a Sub Folder in Project Explorer
To create a new folder, right-click on the project folder (or a subfolder) in the folder panel, and select New Folder from the shortcut menu.
Once you have created one or more subfolders, you can move child windows between folders by dragging & dropping them within the Project Explorer workspace.
Object Manager
Object Manager provides a hierarchy structure to help you view and manipulate layers and plots in the active graph window. It is particularly useful if the graph contains multi-layers and each layer contains multi-plots.
Open/Close Object Manager
When you first start Origin, Object Manager is docked to the right edge of the workspace. Like Project Explorer, you can dock it to any other edge or float it in the workspace. To close/open Object Manager, select menu item View: Object Manager.
Manipulate layers and plots in Object Manager
Object Manager works interactively with active graph window. Selecting layer or plot in graph window will highlight the corresponding item in Object Manager and vice versa. This makes it very easy to select an item and then show or hide it.
For example, try the following:
- Select Help: Learning Center menu or press F11 key to open Learning Center. Select Graph Sample in the left side of dialog, choose Multiple Panel for Samples in drop-down list. Double-click on Multiple Panel by Column Label thumbnail to open the sample graphing project.
- Select any plot object(such as a layer, a plot group or a curve) in graph window, the corresponding items will be highlighted in Object Manager. Select items in Object Manager, the corresponding object will be highlighted in the graph window.
- In Object Manager, Uncheck the checkbox before the plot Trial Run 1 of Layer1 to hide this plot.
- Right click on the plot Trial Run 2 of Layer1 and select Hide Plots with Same Name to hide all plots named Trial Run 2.
- Right click on the plot Trial Run 2 of Layer1 again and select Show All Plots. All Trial Run 2 plots are back.
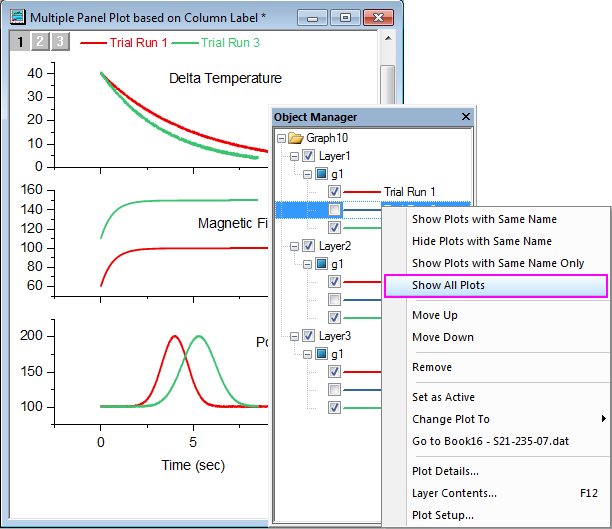
| The plot names in Object Manager is the Auto Legend Translation mode set in the graph. Therefore same name or not depends on what the legend translation mode is used.
|
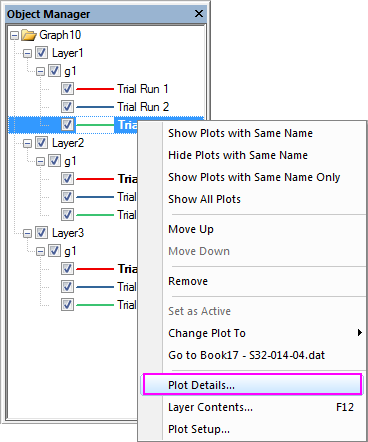
Besides using Object Manager to turning on or off layers or plots, it can also be used to:
- Change plot orders by right clicking on a plot and selecting Move Up/Move Down
- Change plot type by right clicking on a plot and selecting Change Plot To
- Go to source workbook/matrixbook by right clicking on a plot and selecting Go to xxx
- Double click on an item to open corresponding node in Plot Details dialog for futher customization or use context menu to open Useful dialogs.
Apps
Apps are custom applications for Origin that perform specific graphing and/or analysis tasks. Apps are not pre-installed with Origin. If you want to get an App, you can
- Browse to our File Exchange page of the OriginLab website, search and download the app you desired to install.
- Open App Center(by selecting Help:App Center, or pressing F10 key, or clicking the Add Apps button that appears on all tabs of the Apps Gallery), browse available Apps, search for Apps using keywords and phrases, and install or update Apps with a single click.
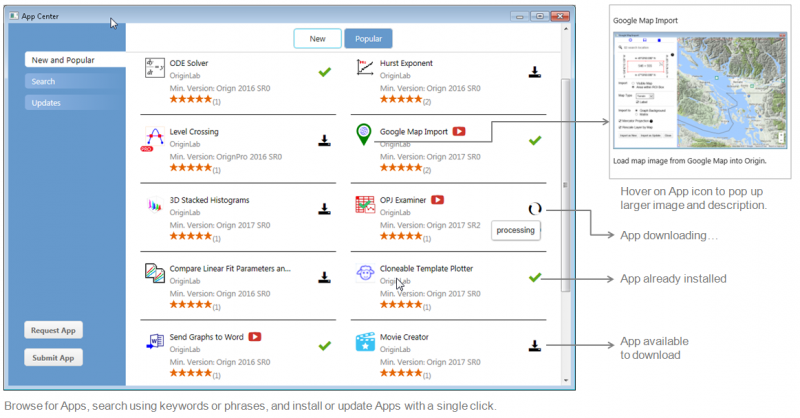
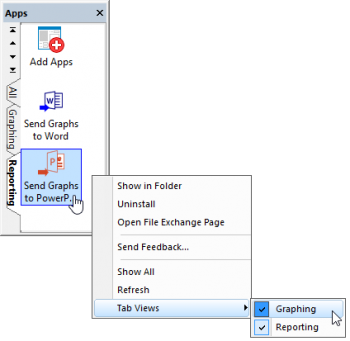
When Apps get installed, they will be visible in the Apps Gallery window of the Origin interface.
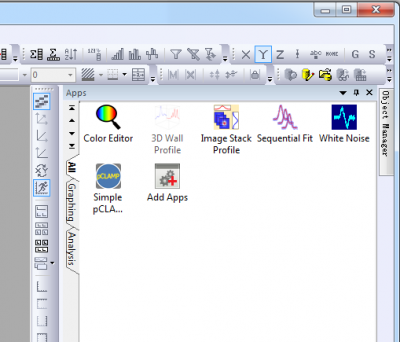
In the Apps panel, you can add new tabs from the context menu and then classify these installed APPs by putting them to different tabs, see "Graphing", "Analysis" tab in the above APP Gallery. All Apps will be presented in the All tab in the order of their installation times.
Each installed App will be displayed as an icon in the gallery window. You can simply click on the icon to launch the App and right-click on the icons for other options such as hiding, uninstalling the App or movement between the tabs.
Learning Center
Learning Center dialog helps you get started with Origin easily. You can select Help: Learning Center from Origin menu or press F11 key to open it.
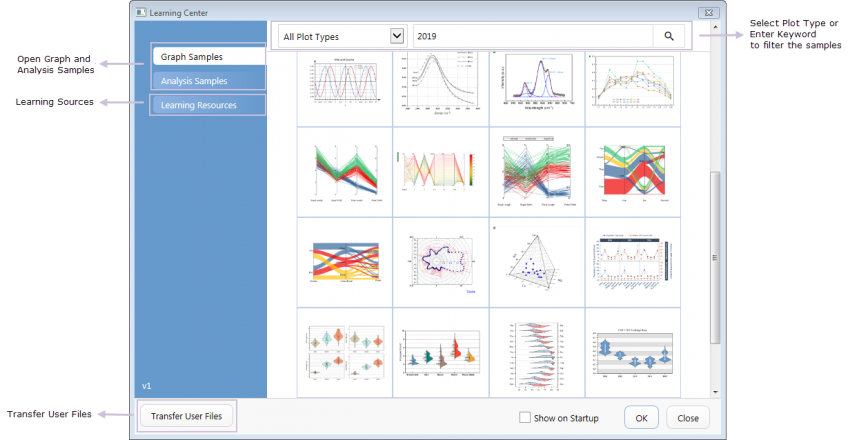
With this dialog, you can
- Open Graph and Analysis Samples
- With the Learning Sources, get started with Origin
- Transfer User Files
Messages Log
The Messages Log window shows messages about operations including Output Information, Results and Errors. It displays messages that are not sent to the Script Window or the Command Window. To close/open Messages Log, press Alt + 6 or select menu item View: Messages Log.
- Open a new workbook, highlight the A(X) and B(Y) columns, right-click and and choose Fill Columns With: Row Numbers from the shortcut menu.
- Highlight the columns and from the Main Menu, choose Plot: 2D: Line: Line. A simple line plot is drawn.
- Select File: Export Graphs... from the main menu to open the ExpGraph dialog. In this dialog, keep the default settings and click OK to export the graph.
- The Output Information is reported to the Messages Log window.
|