1.5 Publishing GraphsGSB-publish-graph-tutorial
In this lesson we will learn about some of the options available for publishing graphs.
Pasting Graphs in Other Applications
- Open the project file saved from lesson four: Merge and Arrange Graphs. Click to select the last graph window that you created.
- Use the menu Edit:Copy Page, or the shortcut CTRL+J, to copy the graph page.
- Launch Microsoft® WORD, then press Ctrl+V. The graph will be pasted as an embedded object in Word.
- Double-click on the graph in Word. A new instance of Origin will be launched. Note that in this instance, only the graph and data related to the graph are available in the project.
- Use menu Format: Page to open the Plot Details dialog in the page level. Then in the right panel, change the background color by choosing the Display tab and setting Color as LT Gray. Click OK.
- From the menu, choose File: Exit & Return to Document1. This will close the instance of Origin, and the graph image in the document will be updated.
- Repeat step 1. This time we will copy the graph page as an EMF image. Press shortcut keys CTRL+C to copy the graph page as an EMF image.
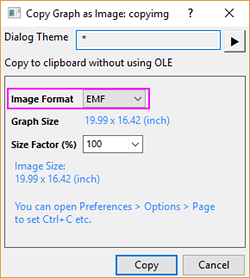
 | There is another tool Copy Page as Image that provides more options. Move mouse to the edge of graph page, the page level mini toolbar will pop up. Select Copy Page as Image button  . .
In the dialog that opens, you can select EMF or other formats from Image Format drop-down list.
|
- Then go back to the Word document, de-select the graph and press Enter to move to a new line in the document. Press Ctrl + V to paste the Origin graph as a picture object. To edit the picture, you can select Format tab, or right click the picture and select Format Picture menu to open the Format Picture panel.
| When the Origin graph is placed as an embedded object in applications such as Word or PowerPoint, all the data associated with the graph are also saved with the Word document. This provides the flexibility of double-clicking and editing the graph in a new instance of Origin. However, if many graphs are placed as objects in a document, the document file size will become large if there is a lot of data associated with the graphs.
|
Sending Graphs to PowerPoint
- With the graph window active in Origin, press the Send Graphs to PowerPoint button
 . .
- Accept all default settings in the opened dialog and click Send. The graph will be pasted as a new slide in the PowerPoint file.
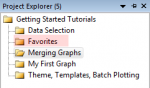
- Right-click on the graph title bar (in Origin) and select Add Shortcut to Favorites. This will add a Favorites folder to the project, visible in Project Explorer.
- In Project Explorer, select the My First Graph folder. Then select the graph window, right-click on the title, and Add Shortcut to Favorites folder. Add shortcuts from other graph windows in the project as desired.
- Go to Project Explorer and activate the Favorites folder. In the bottom panel, without selecting any item, right-click on the white area and choose View:Extra Large Icons from the context menu. This will show the graphs as extra large icons.
| Double-click on the icons in Favorites folder to open the graph for viewing or editing. Right-click on the icon or the graph window title bar for a context menu command to go to the original folder for that graph.
|
- Right-click on the Favorites folder in the upper panel of Project Explorer and choose Send Graphs to PowerPoint. Accept defaults in the dialog that opens. All graphs in the folder will be sent to PowerPoint. Note that you can do this operation in any folder, and not just the Favorites folder.
| The dialog for sending graphs to PowerPoint has options for selecting all graphs in the project, specifying graphs by name, and placing the graphs on duplicate copies of a specific PowerPoint file slide that you can prepare prior to the operation.
|
Slide Show in Origin
- Right-click on the Favorites folder in the upper panel of Project Explorer and choose Slide Show of Graphs from the context menu.
- Accept defaults in the dialog. The slide show will start. Use arrow keys to view the next or previous graph in the sequence.
| In the bottom panel of Project Explorer, switch to Details view (right-click in an empty location and choose View: Details). Right-click on the lower panel title bar and enable Slide. Note that you can drag to reorder the columns. Use the added Slide column to arrange the order of the graphs. Click on the slide column header once, and then you can drag and rearrange the graph entries to set the order. This order will be followed for operations such as slide show, pushing graphs to PowerPoint, and exporting.
|
Exporting Graphs
- Go back to Project Explorer and select the Merging Graph folder in the upper panel.
- Activate the graph and choose File: Export Graphs (Advanced) and change the following dialog box settings.
- Select Portable Document Format (*.pdf) from the Image Type drop-down list.
- Change the Select Graph(s) drop-down to All in Active Folder.
- Expand the Image Size branch and enter 5 in the Fit Width text box.
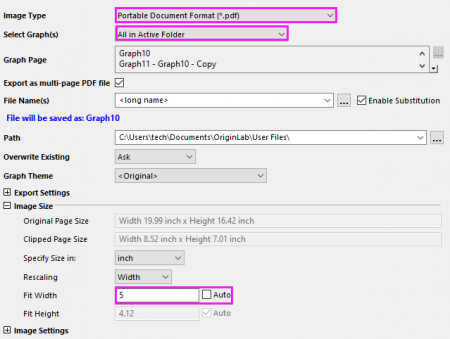
- Click the OK button to close the dialog.
- Click on the Messages Log tab on the left side of the interface. The export file path dumped here is displayed as a hyperlink. By default, it will be your User Files Folder (UFF) path. Clicking the path link will open the exported PDF file in Origin built-in viewer. You can also copy the path, paste to Windows Explorer to open the folder, then view and edit the PDF files.
Save your project file.
|