1.2 Graph Templates and Batch PlottingGSB-template-theme-batchplotting
In this lesson we will learn about graph templates, and also how to perform batch plotting.
Graph Templates
Let's start with the project file we saved in lesson one: My First Graph. Click to select the graph window.
 | You can quickly open recently-saved project files from the File: Recent Projects list.
|
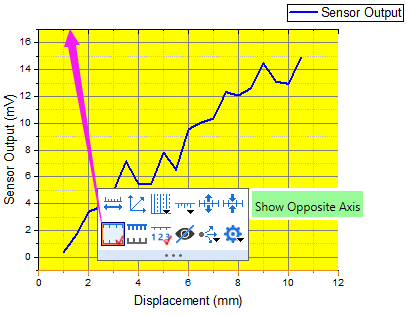
- Click on the X axis, in the pop-up mini toolbar, click the Show Opposite Axis button to show the Top X axis. Do the same for Y axis to show the Right Y axis.
- Now let's save the graph as a template. Right-click on the graph title bar, and choose Save Template As... from the context menu.
- In the dialog, set the Template Name as My Line and click OK to save the template.
- We will now generate a new column of data. Activate the worksheet, click the Add New Column button
 on the Standard toolbar to add a new column to the rightmost. on the Standard toolbar to add a new column to the rightmost.
- Click inside the F(x) cell of this new column, then enter the following:
=Mmovavg(B,2)
Note that when you enter "=" and then an expression, the possible expressions will be listed allowing you to choose to auto-complete the expression. And a message box will pop-up to show the simple description of the expression.
| You can fill a column with an expression also by right-clicking the F(x) cell of this column and selecting Open Dialog... from the context menu.
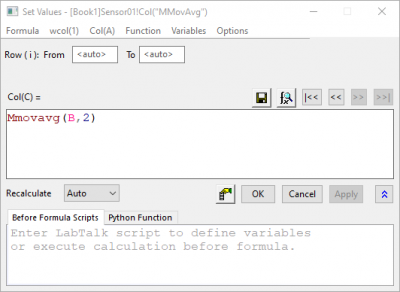
In this dialog, use the Formula: Load Samples menu to view various examples on setting column values. And, the Function menu offers a large selection of functions. You can also search for suitable functions using the search button  . .
|
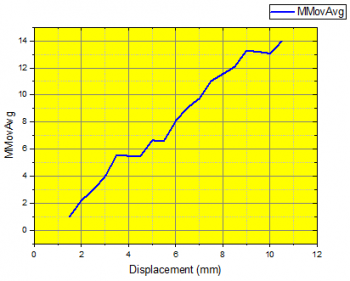
- Press Enter key to return a dataset of modified moving averages using column B data, starting at row 2. Type MMovAvg into the Long Name cell of the column.
- Click on the header of column C to select the entire column. From the menu, choose Plot: User Templates and select the My Line template we created before. A new graph will be created using data from column C.
Batch Plotting
In this section, we will perform batch plotting by first creating one graph and then cloning that graph using other data.
- Go to Project Explorer. In the upper panel, right-click on the root level and choose New Folder.
- Name the folder Batch Plotting. Click on the empty folder to open it.
- Select Help: Open Folder: Program Folder to open the Origin program folder, find and open the \Samples\Import and Export\ subfolder. Press the Shift key and choose the following three files:
- Drag and drop the selected files onto the Origin workspace. The selected files are imported into three new workbooks.
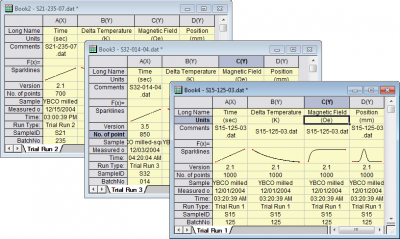
- Select one of the workbooks, then click on the header of column B and drag the mouse to column D, selecting all three columns. Then select the menu: Plot > Multi-Panel/Axis: 3Ys Y-YY.
| Origin will look to the left of the selection to find the X column and plot the selected data against the 1st column in the worksheet.
|
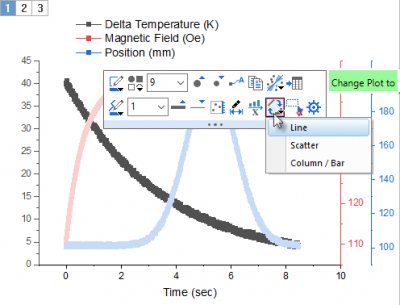
- Click on one plot, in the pop-up mini toolbar, change the plot type of selected plot to Line by using the Change Plot to drop-down list
 . .
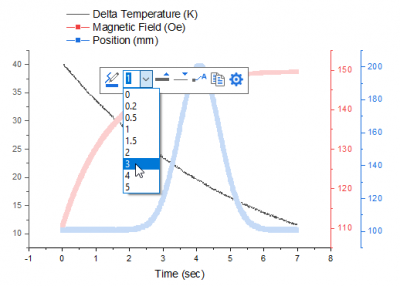
Click on the plot, in the pop-up mini toolbar, change the width to 3 by using the Line Thickness drop-down list  . .
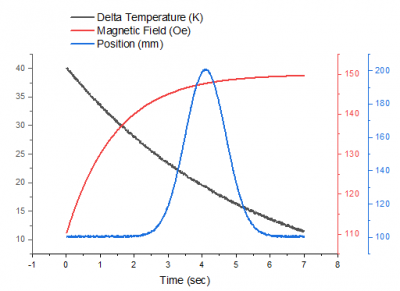
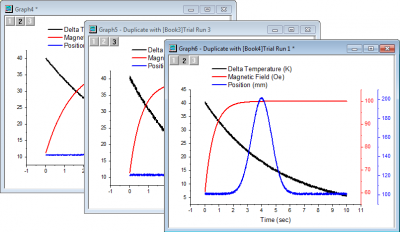
Then, do the same for other two plots to get the following line graph.
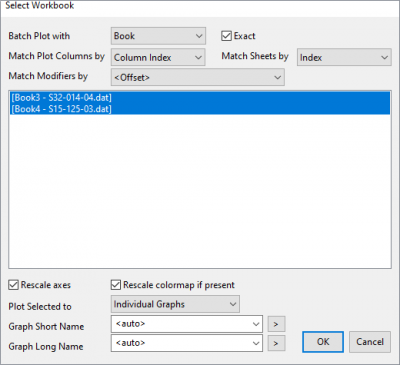
- Now we will clone this graph using data in the other workbooks. Right-click on the title bar of the graph and select Batch Plotting..., and then the Select Workbook dialog will be opened.
- In the dialog, set according to the image below. Make sure you highlight the books.
| You can set the Match Plot Columns by drop-down appropriately to find worksheets in the project that match the data configuration of the current graph.
|
- Click OK. If prompted to rescale the axes to show all data, answer Yes and click OK. Two similar graphs will be created with data from the other two books.
- From the menu, click Save Project button
 on Stardard toolbar to save your modified project. on Stardard toolbar to save your modified project.
|