2.2.25 reducedup
Menu Information
- Worksheet: Reduce Duplicate X Data
- Analysis: Data Manipulation: Reduce Duplicate X Data
Brief Information
Reduce XY data by replacing duplicated X values
Additional Information
Minimum Origin Version Required: 8.1 SR0
Command Line Usage
reducedup method:=mean tol:=1 xcount:=<new>
X-Function Execution Options
Please refer to the page for additional option switches when accessing the x-function from script
Variables
Display
Name
|
Variable
Name
|
I/O
and
Type
|
Default
Value
|
Description
|
| Input
|
iy
|
Input
XYRange
|
<active>
|
Specifies the input data range.
|
| Replace Y With
|
method
|
Input
int
|
0
|
Specifies the value that is used to replace the Y values that correspond to equal X values.
Option list:
- mean:Mean
- Replaces the data points in each group with the mean value of these data points.
- median:Median
- Replaces the data points in each group with the median value of these data points.
- min:Min
- Replaces the data points in each group with the minimum value of these data points.
- max:Max
- Replaces the data points in each group with the maximum value of these data points.
- sum:Sum
- Replaces the data points in each group with the sum of these data points.
- sd:SD
- Replaces the data points in each group with the standard deviation of the Y values of these data points.
- se:SE
- Replaces the data points in each group with the standard error of the Y values of these data points.
- rms:RMS
- Replaces the data points in each group with the Root-Mean-Square of the Y values of these data points.
|
| Tolerance
|
tol
|
Input
double
|
1.0e-8
|
Specifies the tolerance used to test whether two X values are equal. For more details, please refer to the Algorithm section below.
|
| Output
|
oy
|
Output
XYRange
|
<new>
|
Specifies the output range. See the syntax of Output Notations.
|
| Duplicate X Counts
|
xcount
|
Output
XYRange
|
<new>
|
Specifies whether or not to output the count of duplicate X. See the syntax of Output Notations.
|
Description
This X-Function is for removing data rows that have duplicated X values. After reducing the input data with this X-Function, there will not be any pair of X values that are equal to each other. The Y values that correspond to equal X values in the original data will be replaced with a chosen statistical quantity.
Example
The following example shows you how to reduce several rows of data that contain duplicate X values.
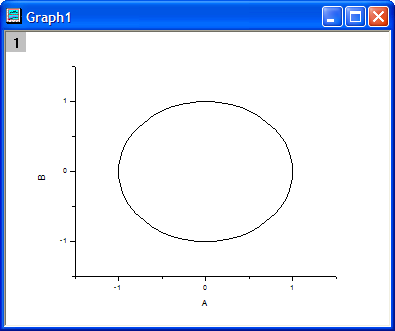
- Create a workbook and import the data <Origin Program Folder>\Samples\Mathematics\Circle.dat.
- Highlight the columns in the worksheet and select Plot: Line: Line from the main menu to create a graph.
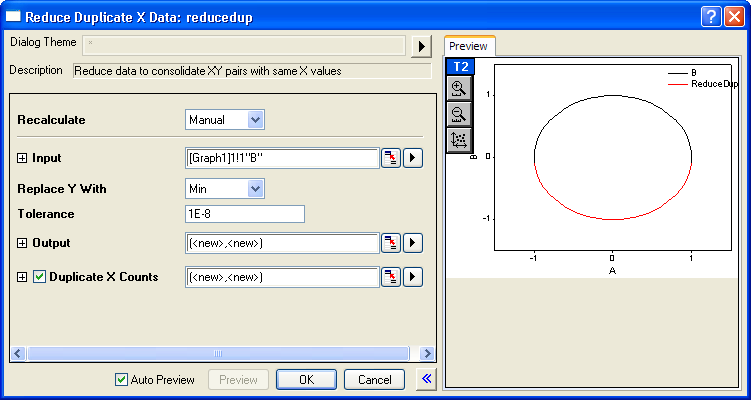
- Make the graph active. Select Analysis: Data Manipulation: Reduce Duplicate X Data from the Origin menu to open the dialog box of the reducedup X-Function.
- Check Auto Preview so that we can see the current result in the Preview window when we change the dialog options.
- Choose Min with the Replace Y With drop-down list.
- Check Duplicate X Counts and enter [<new>]<new> after it. This ensures that you will get the counts of duplicate Xs after reducing the data.
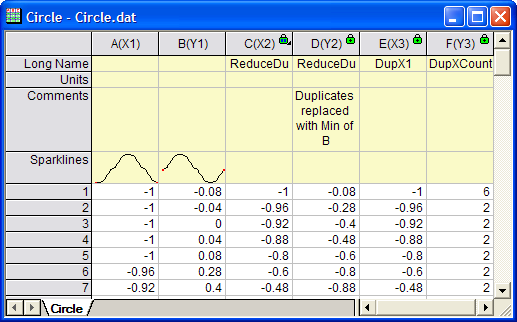
- Click the OK button. You can see the results in the original workbook and the graph.
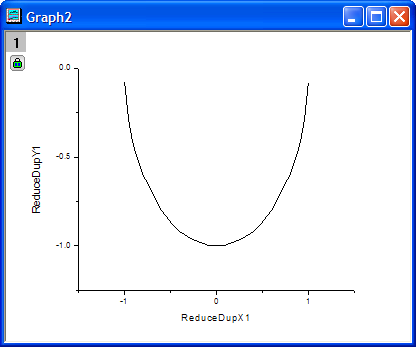
- Now we plot the reduced data separately. Go to the workbook. Highlight col(C) and col(D). Select Plot: Line: Line from the Origin menu to create a new graph.
Algorithm
- Tolerance for testing whether two values are equal
Some X-Functions that test for equality include a tolerance. This algorithm tests whether two X values are equal.
For a given vector, firstly sort it ascending, and suppose the sorted vector is ") , where , where  is the size of the vector. The following steps are the procedure for testing whether two X values are equal with a specified tolerance, is the size of the vector. The following steps are the procedure for testing whether two X values are equal with a specified tolerance,  . .
- Find the maximum and minimum of the vector, say
 and and  respectively. respectively.
- Calculate a testing value,
 , by using: , by using:
-
")
- Loop over all values in the sorted vector, from
 to to  , comparing the absolute value of , comparing the absolute value of ") with . with .
- If
 \le dTol") , we will say that , we will say that  , else, , else,  . .
- When multiple X values are determind equal, say
") , where , where  , the display X value for this "equal" X values is defined as: , the display X value for this "equal" X values is defined as:
- If the number of this "equal" X values is even, the display X value is
 . .
- If the number of this "equal" X values is odd, the display X value is
 . .
Related X-Functions
stats, reducexy
Keywords:data reduction, average, mean, sum, minimum, maximum, statistics
|