1.7 Polyline ProfilesPolyline-Profiles
Summary
This Polyline Profiles App can be used to produce line profiles for an image/contour plot. The line can be a straight line, polyline, or freehand line.
The built-in Profile Plot in Origin only handles horizontal, vertical, and straight lines. This App is therefore useful for polyline and freehand line profiling.
Tutorial
- Create a new matrix by clicking the New Matrix button
 from Standard Toolbar. from Standard Toolbar.
- With this matrix window activated, select menu Data: Import From File: Image to Matrix... to import the image <Origin Installation Director>\Samples\Image Processing and Analysis\Flower.jpg into this matrix.
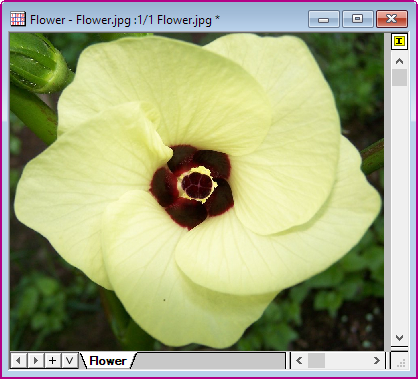
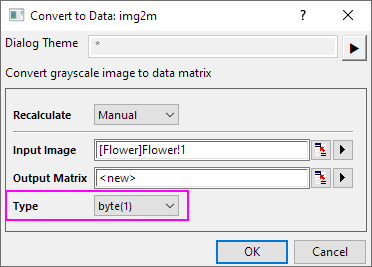
- Next, we are going to create an image plot. However, this app works for those image plot created from matrix data, but not matrix image. So, we need to convert the image into matrix data first. To do this, choose menu Image: Conversion: Convert to Data. When the dialog opens, set Type to byte(1).
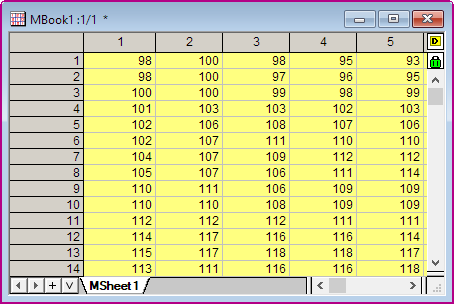
- Click OK to get the matrix data of the image.
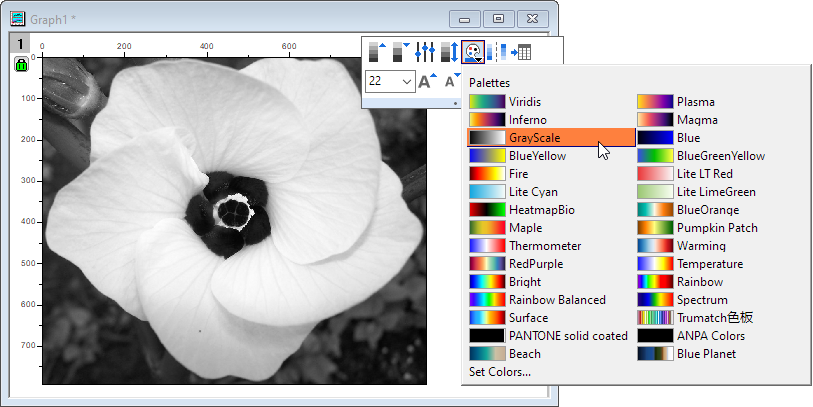
- Keep the matrix with data active, then select menu Plot: Contour: Image Plot to create an image plot. And use Palettes button in Mini Toolbar to change to GrayScale palette.
- From Tools toolbar, select the Polyline Tool button
 to draw a polyline on the image plot. It may look like the picture shows below. to draw a polyline on the image plot. It may look like the picture shows below.
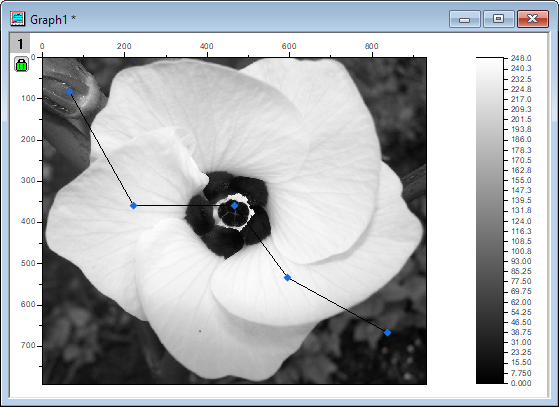
- Click the Polyline Profiles icon
 from the Apps gallery to open the Polyline Profiles dialog. As you can see, the drawn polyline is Profile Line in the dialog, and the preview graph is also shown for the profiling result. from the Apps gallery to open the Polyline Profiles dialog. As you can see, the drawn polyline is Profile Line in the dialog, and the preview graph is also shown for the profiling result.
Note: Pressing F1 key, the help file for this dialog will pop-up.
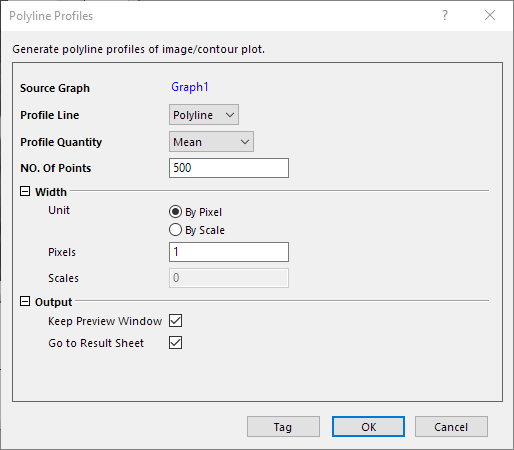
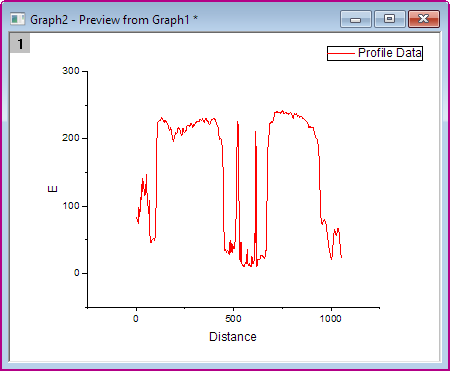
You can also change the polyline from the image plot, such as rotating, resizing, etc., so to get different profiling result.
- Keep the default settings of the dialog, and click OK button. So the preview window will be kept and the result worksheet with the profiling data will be activated.
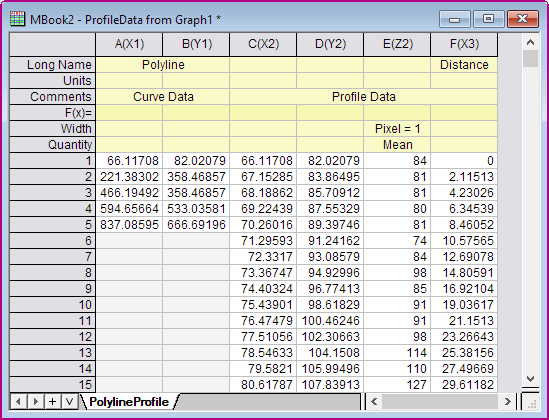
Note: The result may be different because of the difference between each drawn polyline.
Dialog Settings
| Source Graph
|
This is the short name of the active graph when launching the app.
|
| Profile Line
|
List all available curves from the image/contour graph, and the selected one will be used for profiling.
|
| Profile Quantity
|
Specify the value of the width range to plot the profile line. If the contour plot is created from XYZ data, this drop down box is hidden, and Mean is used for the calculation.
- Min
- Max
- Mean
- Median
- Sum
- SD
|
| NO. Of Points
|
Specify how many points to generate for the profiling. Default is 500, and if the specified value is less than 2, 500 will be used.
|
| Width
|
Specify the width of polyline. If the contour plot is created from XYZ data, the width can only be specified by using scale as unit.
- Unit
- By Pixel: Use pixel as unit to specify the width.
- By Scale: Use scale as unit to specify the width.
- Pixels
- Pixel value of the width.
- Scales
- Scale value of the width.
|
| Output
|
- Keep Preview Window
- Specify if to keep the preview window after clicking OK button.
- Go to Result Sheet
- Specify if to activate the result sheet after clicking OK button.
|
| Tag button
|
This button will keep the preview window with the current settings, and the corresponding result data is written into result sheet. Then a new profiling of current selected profile line is added to preview window.
|
|