1.26 Batch PlottingBatch-Plotting-APP
Summary
Origin provides several ways for creating multiple graphs by duplicating a graph from other data. For example, Origin has built-in menus Duplicate (Batch Plotting) and Save Template As when you select a graph window and right-click on the window title bar. As these menu items may not be obvious, we have created an app called Batch Plotting. This app provides all batch plotting options in one dialog.
Tutorial
Please download Batch Plotting App.opju from here. Open it inside Origin.
batch plotting from other columns
In Project Explorer docked at the left, browse to folder Other Columns. Here we plotted a violin graph, Graph2 from col(C) from workbook automobilecat. We will use Batch Plotting app to create similar graphs from columns D to G that have the same data type.
- With Graph2 active, click Batch Plotting icon
 from Apps Gallery to launch the app's dialog box. from Apps Gallery to launch the app's dialog box.
- There are several options in this dialog.
- On the left panel, the drop-down list on the top allows you to choose to plot from an existing graph, cloneable template, or existing sheets. In this case, we will leave it as Use Existing Graph > Graph2.
- On the right panel, the top control provides the options to plot with new columns, new sheets, or new books. Here we select New Columns.
- Select columns D to G to create graphs from. As you select each column, you can view the preview of each plot on the left panel.
- Once the columns are selected, the drop-down list below the column list box allows you to decide to create individual graphs or to plot on all one single graph. Here we select to Plot Selected as Individual Graphs.
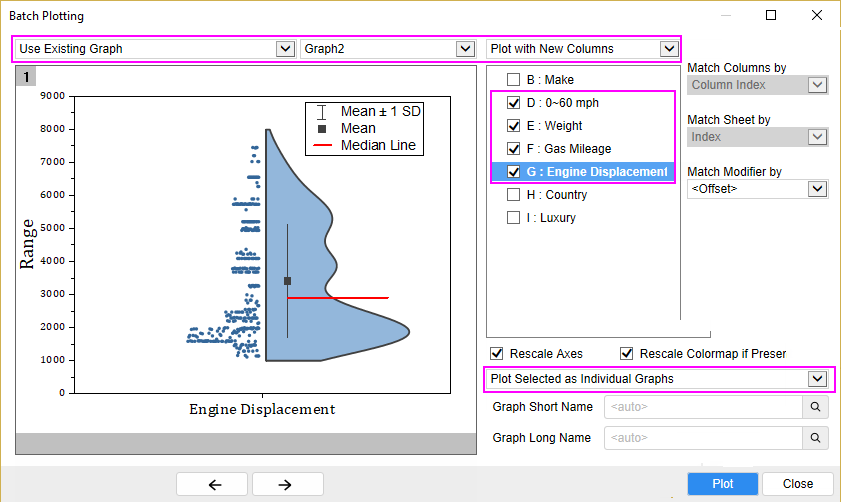
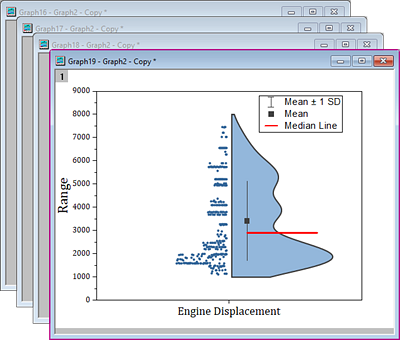
- Click Plot. And click Close. 4 graphs are now created.
batch plotting from other sheets
Go to folder Other Sheets or Books. Here we have a triple-Y plot, Graph1 created from worksheet Trial Run 1 in Book2. This example will show you how to duplicate this graph from data from other sheets or books.
- Activate Graph1. Click on Batch Plotting icon in Apps Gallery to launch the app.
- This time choose Plot with New Sheets. All the sheets in the project that match this data structure will be listed in the box below. Choose worksheets Trial Run 2 and Trial Run 3 in this folder.
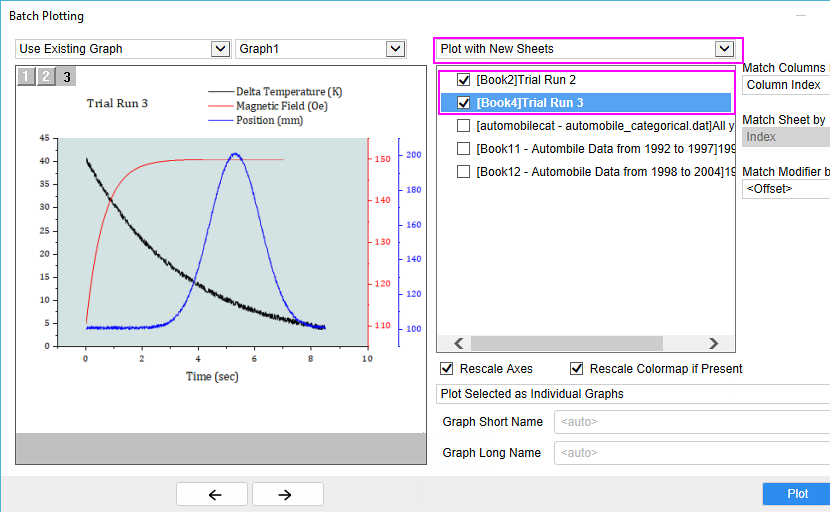
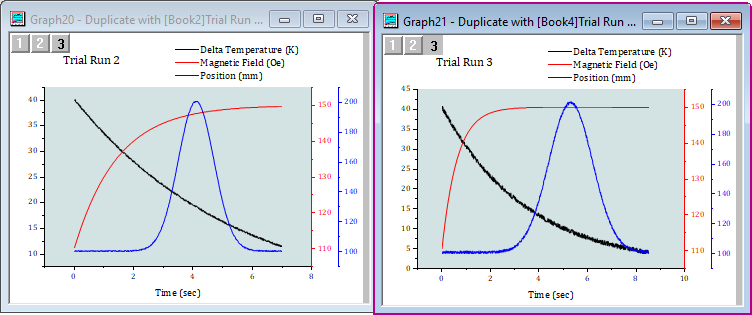
- Click Plot. And click Close. 2 graphs are quickly created from the other two sheets.
batch plotting using template
Open folder Using Template. Here we have a complex graph, Graph6 created from multiple columns of data, where different XY mappings have been used. The top panel is a double-Y Trellis plot. The bottom left panel is a Violin plot and the bottom right is a Scatter plot with color mapping. To duplicate this graph from data is more complex.
In this example, we will save this graph as a template and use it to create similar graphs from other workbooks.
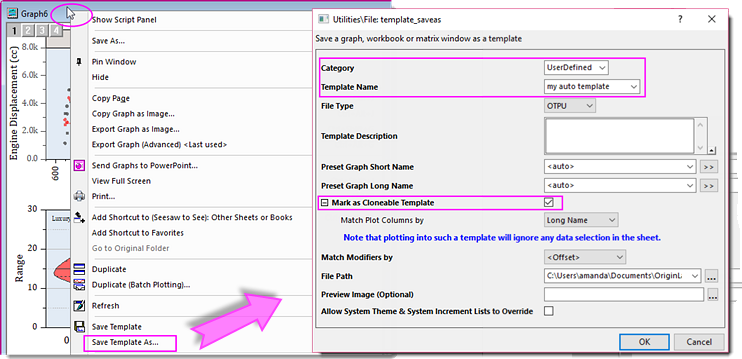
- Activate Graph6. Right-click on window title bar and select Save Template As.
- In the dialog that opens, give a specific name such as my auto template. Make sure Mark as Cloneable Template is checked. What this checkbox does is to remember all the complex relationships between the columns, plot layers, and graphs. Click OK.
- Activate Book12 that has data that is suitable for creating this graph. Click on Batch Plotting icon in Apps Gallery to launch the app.
- This time, select Use Cloneable Template. Origin will always pick up the last template that was saved. It then shows all the books in the project that match this template. Select Book11 and Book12 and click Plot.
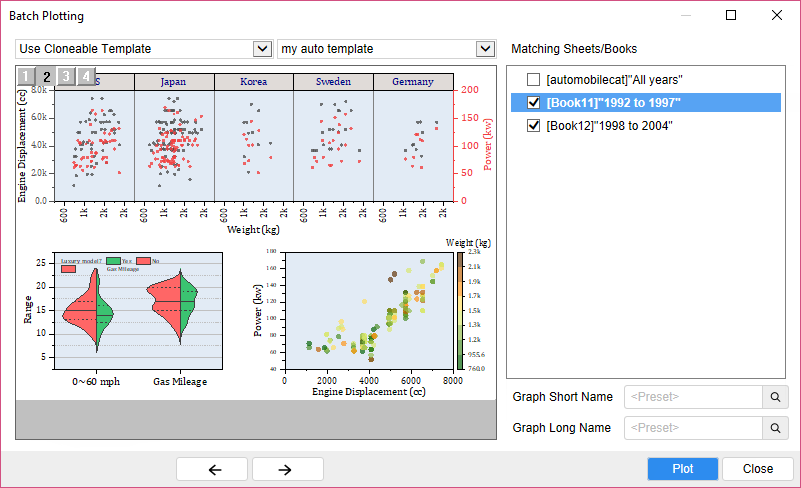
This gives you a quick way for creating complex plots with complex mapping of columns to layers.
|