Synergistic Effects of Drugs continued...
|
Experimental Methods
The study was approved by the Animal Ethical Committee at the University of Gothenburg. The Mann-Whitney U-test and ANOVA with multiple comparisons (Scheffe's test) were used for analyses of statistical differences in graft survival between groups. Fischer's exact two-tailed test was used to compare differences in ratios of tolerant rats.
|
|
Graphing methods
The data for the charts shown on the following pages was entered by researchers into an Excel spreadsheet. Dr. Olausson developed an Origin template that includes six graphs per page, allowing readers to easily visualize the relationship between thedata. He took advantage of the fact that one can make essentially any imaginable change to the visual display of data using Origin. He adjusted the fonts, orientations, sizes and colors of various features for maximum impact. Storing this formatting in a template eliminated the need to format each individual graph. Olausson took advantage of being able to open his Excel workbook in Origin to link the data in the spreadsheet to the graph. He then used a one-click Origin function to convert the data from probability to percentages that can be better understood by most physicians.
|
|
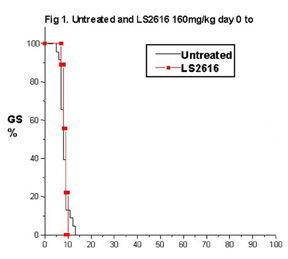
Figure 1 Effect of Linomide on graft survival in otherwise untreated animals.
|