4.1 Import ShapefileImport-Shapefile
Summary
The Import Shapefile app draws 2D objects from ESRI Shapefiles. Optionally, this data can be saved into a worksheet. These 2D objects include-
- points, which usually represent site locations;
- lines, which usually represent rivers, roads, and utilities;
- polygons, which usually represent geographic and political boundaries.
Points are generated as a regular scatter plot, while line shapes and polygons are rendered as graph objects. It's possible to select and modify the line and fill properties of each shape provided that the partial modification option is turned on while importing this data. We recommend turning off the partial modification option when there are too many features, as these may slow down the process depending on your machine's performance.
Tutorial
The imported shapefiles from:
- Right-click on the Import Shapefile icon
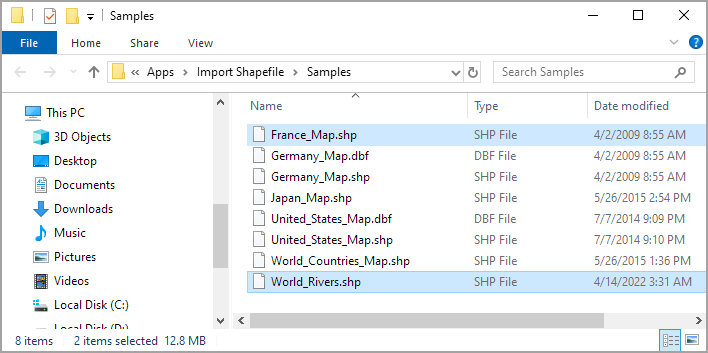
 from the Apps panel, and select Show Sample Folder to open the app sample folder. from the Apps panel, and select Show Sample Folder to open the app sample folder.
- Download additional sample file Import_Shapefile_App.zip. Unzip the file, and put these files (France_Map.shp, World_Rivers.shp) into the app sample folder.
Sample 1
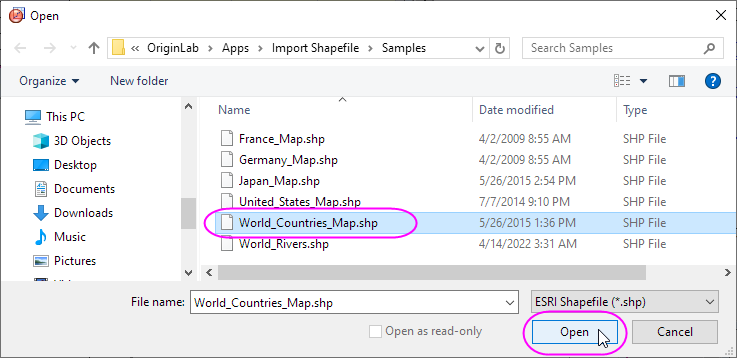
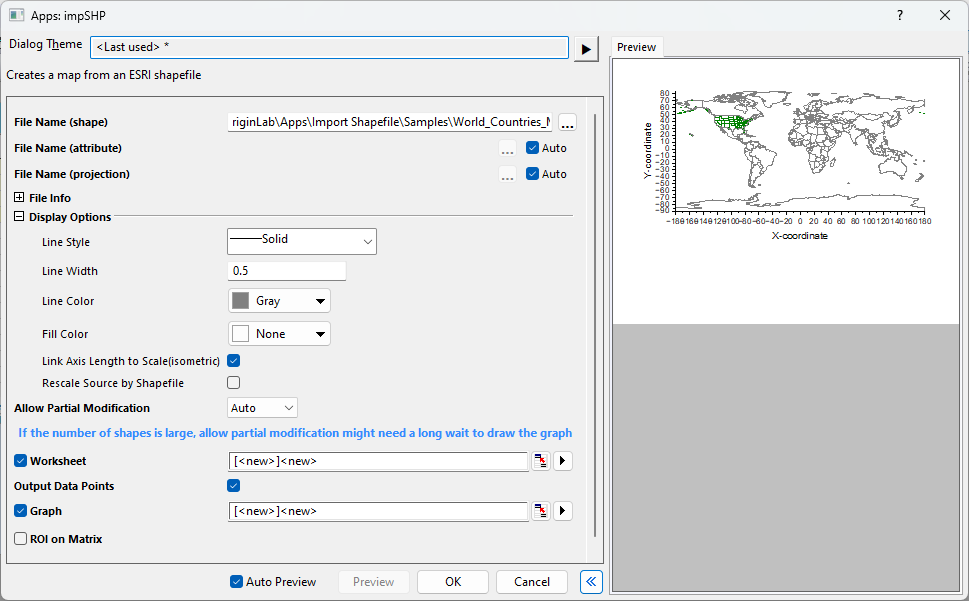
- Click on the Import Shapefile icon from the Apps panel, and select the World_Countries_Map.shp file in the app sample folder, click Open to open the APPs: impSHP dialog.
- In the app dialog, set Line Color to Gray, and check Output Data Points option.
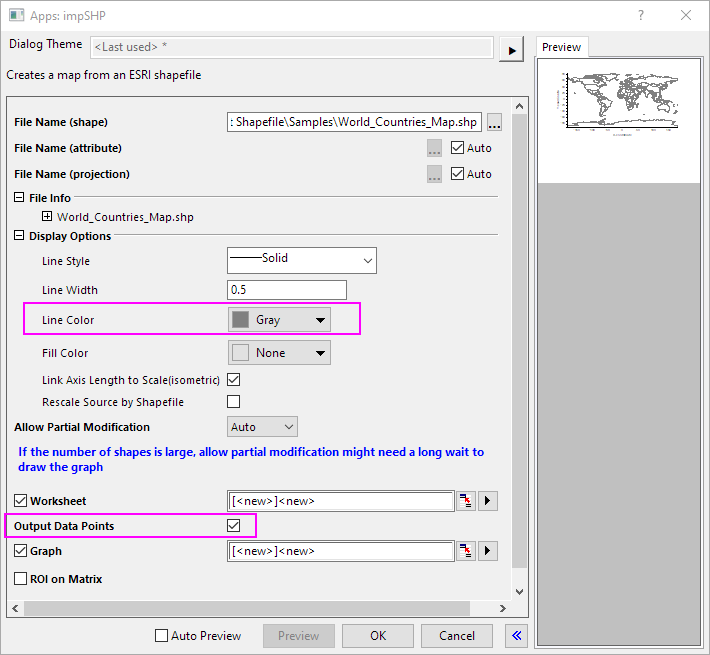
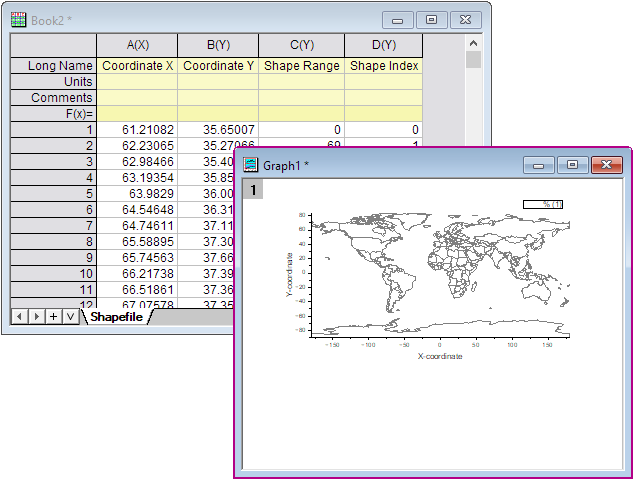
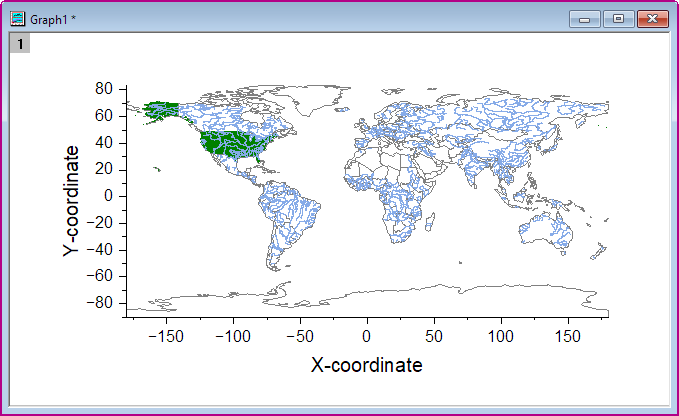
- Then Click OK button to create a World Countries map graph. And the Shapefile dataset is imported in a Worksheet.
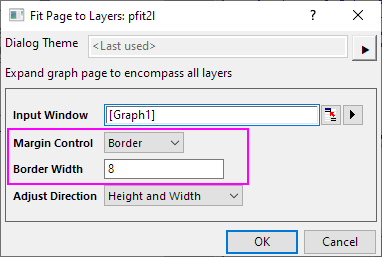
- Activate the Graph window, and right-click on the blank space to select Fit Page to Layers. In the dialog, set Margin Control to Border and Border Width to 8. Click OK button.
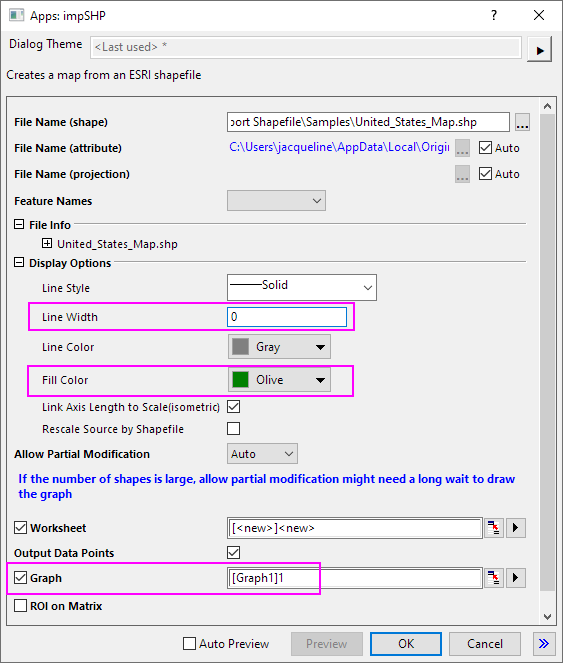
- Activate the Graph window, click on the Import Shapefile icon again, and select the United_States_Map.shp file in the app sample folder, click Open to open the app dialog.
- In the app dialog, set Line Width to 0, and Fill Color to Olive. Make sure the Graph is [Graph1]1 (the activated graph) . Click OK button.
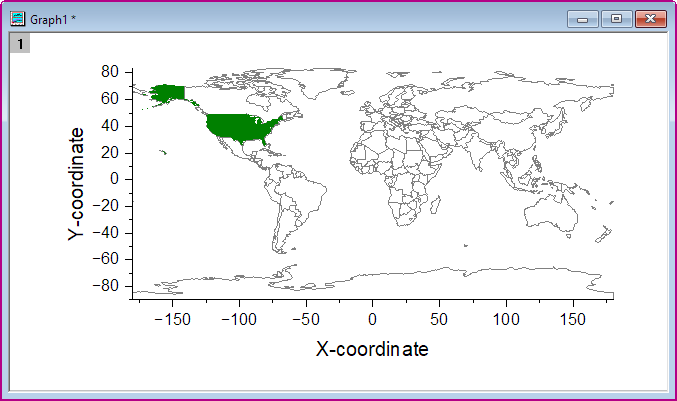
- The United States map is added on the World map, and the area is filled. And the Shapefile dataset is imported in a new Worksheet.
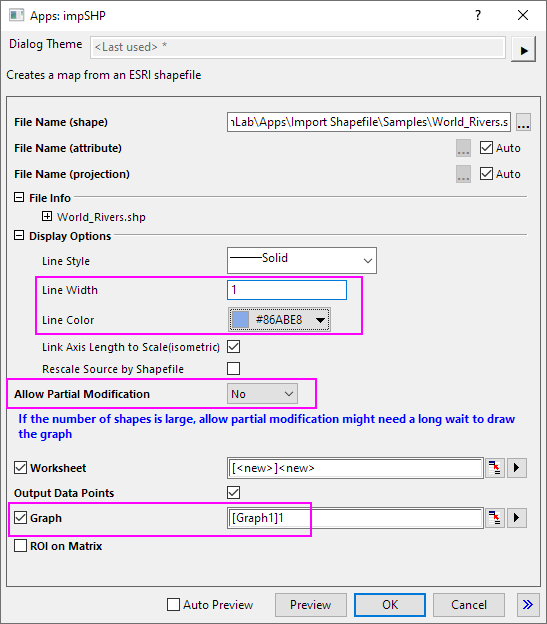
- Activate the Graph window, click on the Import Shapefile icon again, and select the World_Rivers.shp file in the sample folder, click Open to open the app dialog.
- In the app dialog, set Line Width to 1, and Line Color to #86ABE8. Select No for Allow Partial Modification. Make sure the Graph is [Graph1]1 (the activated graph) . Click OK button.
| Note: The line shapes and polygons in the graph are rendered as graph objects. It's possible to select and modify the line and fill properties of each shape provided that the Allow Partial Modification option is turned on while importing this data (Please refer to step8 in Sample 2). But when there are too many features, these may slow down the process depending on your machine's performance. So we recommend turning off the partial modification option here.
|
- The River lines are added on the World map.
Sample 2
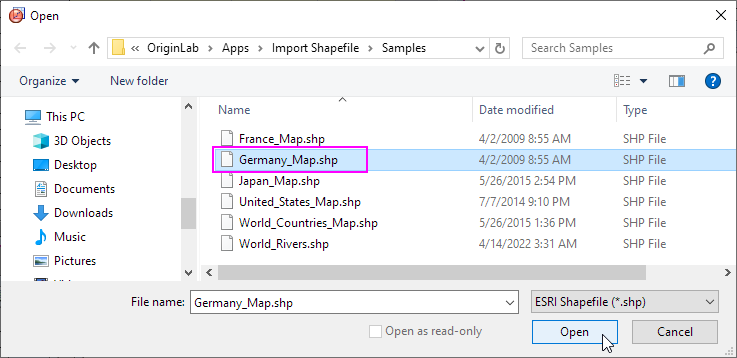
- Click on the Import Shapefile icon from the Apps panel, and select the Germany_Map.shp file in the app sample folder, click Open to open the app dialog.
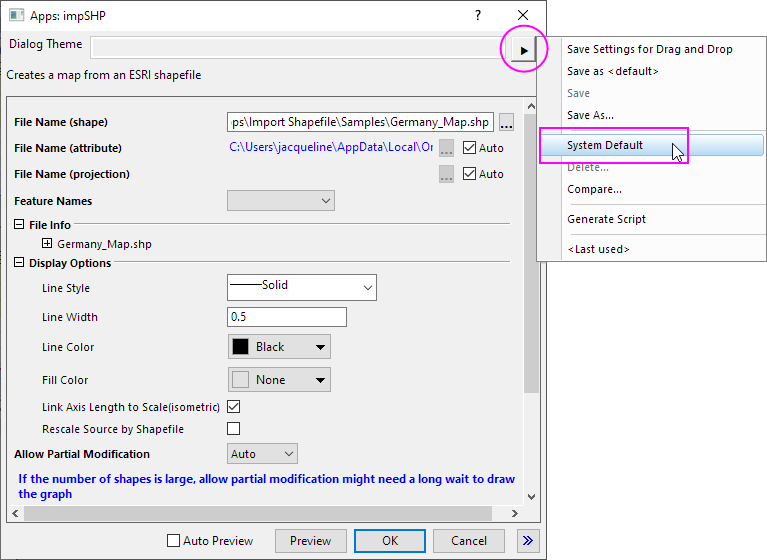
- Click the triangle button on the top-right of the dialog, and choose System Default. Then the dialog rolls back to default setting.
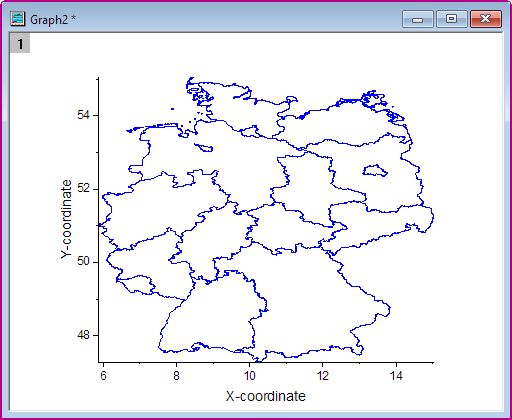
- Set Line Color to Blue. Make sure Graph is set to New Graph [<new>]<new>. Click OK button.
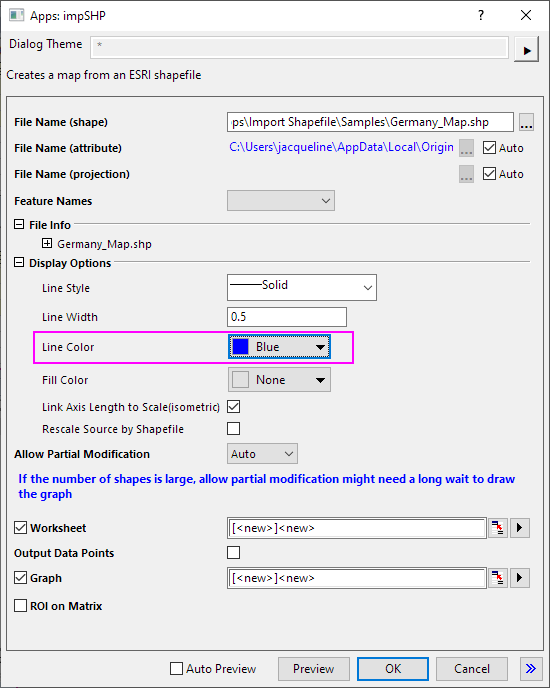
- The German map is created.
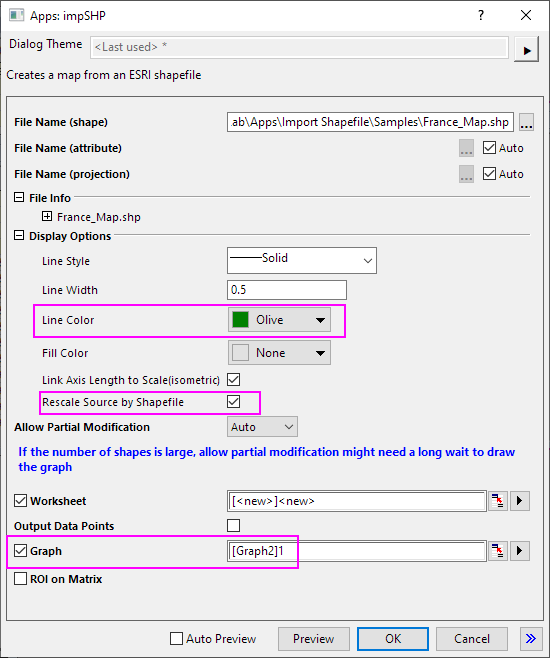
- Activate the Graph window with German map, click on the Import Shapefile icon again, and select the France_Map.shp file in the app sample folder, click Open to open the app dialog.
- Set Line Color to Olive. Check Rescale Source by Shapefile. Make sure the Graph is [Graph2]1 (the activated graph) . Click OK button.
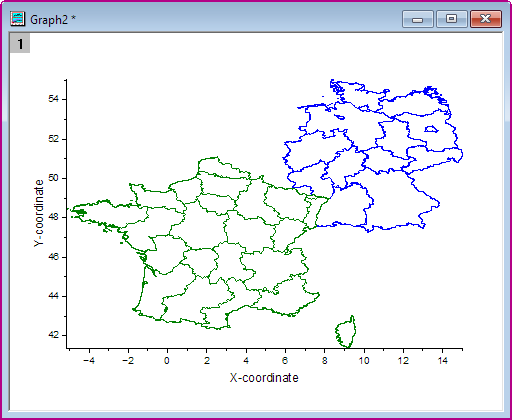
- The France map is added on the graph next to the Germany Map. The graph auto rescale.
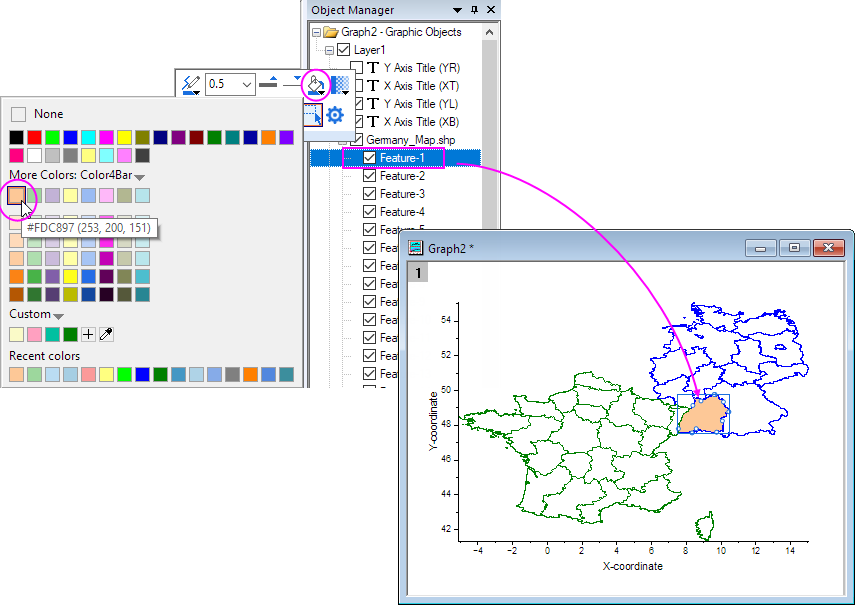
- If Allow Partial Modification is available when import shapefile, after importing you can custom the format of polygons by selected in the Object Manager.
Dialog Settings
| File Name (shape)
|
Name of the file with the geometry for all features.
|
| File Name (attribute)
|
Name of the file that stores feature attributes
|
| File Name (projection)
|
Name of the file that contains information on projection format
|
| Feature Names
|
Feature attribute to import. Available if File Name (attribute) is specified.
|
| File Info
|
File info of shapefile
|
| Display Option
|
Line style of lines or polygons.
Line width of lines or polygons.
Line color of lines or polygons.
Fill color of polygons.
- Link Axis Length to Scale(isometric)
Specify the Link Axis Length to Scale with X:Y Ratio=1 for shapefile layer. The option is selected by default.
- Rescale Source by Shapefile
- If import the sharp file to the active graph window and check this option, the graph axis will be rescaled according to the shapefile. If uncheck it, the active graph axis scale will not be changed.
- If import the sharp file to a new graph window, this option will not affect the axis scale of the new graph.
|
| Allow Partial Modification
|
Specify the shapefile polygons import as multiple object or single object. After importing, you can check the result In the Object Manager window. There are three options:
- Auto: Origin will check the number of the shapefile polygons. If shapefile polygons > @shpdl (@shpdl is a System Variable, by default to 30K), it will be imported as a single object.
- Yes: Import the shapefile polygons as as a single object.
- No: Import the shapefile polygons as multiple objects.
|
| Worksheet
|
Save the raw data into a worksheet.
|
| Output Data Points
|
Output the graph data points to workbook.
|
| Graph
|
The graph to create a map.
|
| ROI on Matrix
|
Import shapefile as ROI on matrix window.
|
|