2.10.9 plot_gindexed
Menu Information
Plot > Categorical: Grouped Columns...
Plot > Categorical: Grouped Scatter...
Brief Information
Create grouped column/bar/scatter plot with indexed data
Additional Information
Minimum Origin Version Required: 9.1 SR0
Command Line Usage
1. plot_gindexed iy:=[Book1]Sheet1!(,B,C) group:=[Book1]Sheet1!col(D); //Column B as input Y, column C as Y error, column D as grouping range
2. plot_gindexed iy:=[Book1]Sheet1!((,2),(,3)) group:= [Book1]Sheet1!(4,5) plottype:=1; //Column 2 and 3 as input Y, column 4 as the first grouping range, column 5 as the second grouping range.
X-Function Execution Options
Please refer to the page for additional option switches when accessing the x-function from script
Variables
Display
Name
|
Variable
Name
|
I/O
and
Type
|
Default
Value
|
Description
|
| Data Column(s)
|
iy
|
Input
XYRange
|
<active>
|
The input data range. It can be one or more Y columns, optionally with associated Y error columns.
|
| Group Column(s)
|
list
|
Input
int
|
0
|
This variable is not supposed to be changed by users.
|
|
|
btn
|
Input
int
|
0
|
This variable is not supposed to be changed by users.
|
|
|
group
|
Input
Range
|
<unassigned>
|
The data range of the grouped column.
|
| Sort Groups
|
sort
|
Input
int
|
1
|
This variable is not supposed to be changed by users.
|
| Label
|
label
|
Input
Column
|
<optional>
|
Specify a column as label source.
|
| Plot Type
|
plottype
|
Input
int
|
0
|
Plot type. Allowed values:
- 0=column:Column
- 1=bar:Bar
- 2=scatter:Scatter
|
| Graph Template
|
template
|
Input
string
|
<auto>
|
Select a tempplate to create the graph. By default, Auto is checked and the built-in template "gbox" is used.
|
| Output Data
|
rd
|
Output
ReportData
|
[<input>]<new>
|
Specify where to output the calculated data.
|
Description
This X-Function creates a grouped column/bar plot or grouped scatter plot from indexed data. You can specify the input range (possible to include Y error columns), the grouping range and the label source with specified sequences.
Note: in Origin 2017 or ealier versions, this X-Function is not accessible from LabTalk script. To plot grouped column/bar chart from script, you will need to use
worksheet -px
Below are 2 examples:
worksheet -px ? gColumn plot_gindexed iy:=[Book1]Sheet1!(,B,C) group:=[Book1]Sheet1!col(D);

worksheet -px ? gColumn plot_gindexed iy:=1!((,2),(,3)) group:= 1!(4,5) plottype:=1;
Examples
Use the following script to import the Categorical Data.dat file under <Origin EXE Folder>\Samples\Graphing path, and then create two grouped column plots from column B: one with column C as first grouping level and D as the second grouping level, the other with column D as the first grouping level and C as the second.
doc -s;
doc -n;

newbook;
string fn$=system.path.program$ + "Samples\Graphing\Categorical Data.dat";
impASC fname:=fn$;

string bkn$ = %H;
plot_gindexed iy:=1!col(B) group:=1!(C,D);
window -a %(bkn$);
plot_gindexed iy:=1!col(B) group:=1!(D,C);
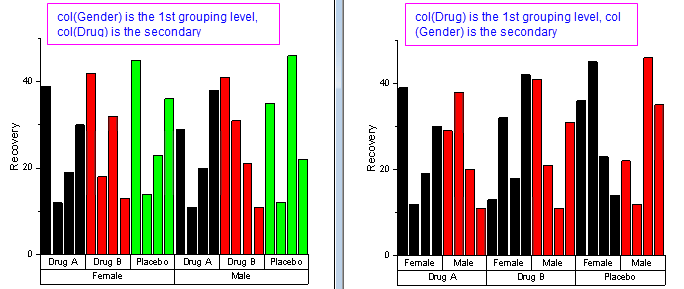
- Note: The sequences of grouping range is decided by the sequence of them in the group variable definition.
|