4.8.5 Batch Processing Grouped Datasets Using Analysis Template with Multi-Data SheetsBatchProcess-GroupData
Summary
Origin can perform batch analysis on grouped datasets using an analysis template with multiple data sheets.
Minimum Origin Version Required: 2016 SR0
 | While not as flexible or powerful as the Batch Processing, you can "clone" import and analysis operations in the active workbook, using the procedure outlined in this tutorial.
|
What you will learn
This tutorial will show you how to:
- Create a multi-data sheets analysis template
- Perform batch analysis on grouped datasets using analysis template
How the Analysis Template Works
The reference multi-data sheets analysis template Multi-Data Sheets Analysis.ogw that we are going to make is located in <Origin EXE Folder>\Samples\Batch Processing folder. This analysis template will process 10 CSV files located in <Origin EXE Folder>\Samples\Batch Processing folder in group of 5. Every 5 data files will be imported into the sequential data sheets in the analysis template and a non-linear fit will be conducted to obtain the peak area and its standard error of each curve. Eventually we will perform linear fit to peak area versus temperature data extracted from file name and output the results.
Steps
Create Multi-Data Sheets Analysis Template
Import CSV Files into Sequential Data Sheets
- Create a new workbook. From the menu, click Data: Connect Multiple Files to open the files2dc dialog.
- Set the Data Connector dropdown to CSV, then browse to the <Origin EXE Folder>\Samples\Batch Processing folder and select the first five data files.
- Check the Same Book box and click OK.
Perform Nonlinear Fit to Obtain Peak Area
- Highlight column 2 in sheet T275k, hold Ctrl + Y or go to menu Analysis: Fitting: Nonlinear Curve Fit to open the NLFit dialog.
- Set Recalculate = Auto.
- Select Gauss as Function in Origin Basic Functions category.
- Click Fit button to perform the fitting. Click OK in the prompt to close it.
- Repeat steps 4 - 7 for data T285k, T295K, T305K, T315K to obtain peak areas for all five peaks.
Prepare Data for Linear Fit
- Right click sheet tab FitNLCurve5 and select Add to add a worksheet. Double click on the name and input TempData as sheet name.
- Hold Ctrl+D to open Add New Columns dialog and input 2 in the edit box to add 2 extra columns. Click OK button to close dialog.
- Set the Long Name of the 4 columns as Data File, Temperature, Area Value, Area Error, respectively.
- Right click the first data cell in column Data File and select Insert Variable to open dialog. In the right panel, right-click the Book node and check Show Sheet Level to show sheets in the book. Then click T275K sheet on the right panel and click Label tab on the left panel. Click property Name to highlight that row and click Insert button to insert sheet name into this cell.
- Repeat this step for other four sheets to add the sheet name to column Data File.
- Next we want to extract the temperature number from sheet name in first column, to do so highlight column Temperature and right click to select Set Column Values.... Input formula below in the edit box to extract the middle 3 numbers from file name and click OK to close dialog and apply.
Value(mid(col(A),2,3)$)
- Go to sheet FitNL1 and highlight the two value cells under variable A in Summary' node. Right click to select Copy to copy the data. Then go to TempData sheet and paste link the data in the first row in column Area Value and Area Error. Repeat this step for other four data files.
- Set the designation of column Temperature as X, column Area Error as Y Error.
Perform Linear Fit and Create Result Sheet
- Highlight column Area Value and Area Error and go to menu Analysis: Fitting: Linear Fit to open dialog, select Recalculate mode as Auto, click OK to perform linear fitting and close the dialog. Click OK in appeared prompt to close it.
- Right click sheet tab FitLinearCurve1 and select Add to add a new sheet and name it as Results.
- Hold Ctrl + D to open Add New Columns dialog and input 3 in edit box to add 3 new columns.
- Set the Long Name of the 5 columns as Intercept Value, Intercept Error, Slope Value, Slope Error and Adj. R-Square, respectively.
- Go to sheet FitLinear1, copy the 5 value cells under Summary node and go back to Results sheet and click the first cell in first data row to paste as link.
- Go to menu File: Save Workbook As Analysis Template... to save it as an analysis template and name it as Multi-Data Sheets Analysis.
Batch Analyze Files in Groups
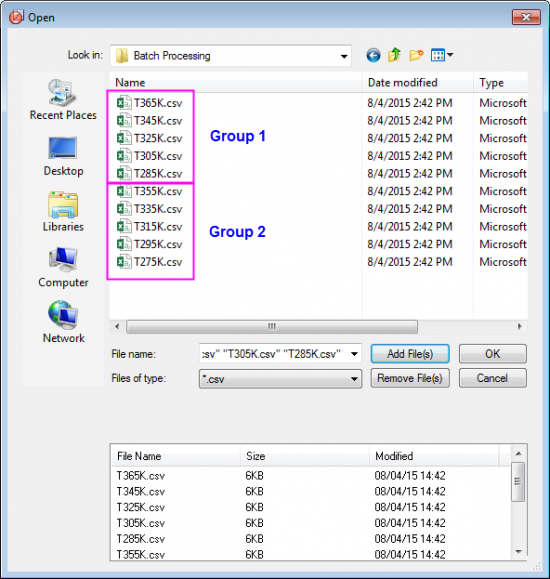
In <Origin EXE Folder>\Samples\Batch Processing folder, we have 10 CSV data files. Suppose now we want to group the files as two groups and re-order them as: group 1 as T365K, T345K, T325K, T305K, T285K; group 2 as T355K, T335K, T315K, T295K, T275K. After we will process those two grouped files using the analysis template we created in section above.
- Go to menu File: Batch Processing... to open dialog, click the more options button next to Analysis Template edit box to browse to analysis template Multi-Data Sheets Analysis.ogwu.
- Click the more options button next to File List edit box to bring up Open dialog. Firstly drag and drop CSV files one by one to re-order them as shown below and click Add File(s) button to add the files to list. Click OK button to exit dialog.
- Select File Name as Dataset Identifier, Results sheet as Result Sheet and uncheck Delete Intermediate Workbook.
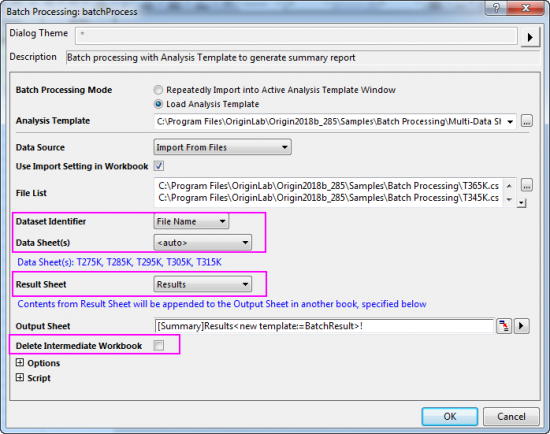
- Click OK button to start processing. And click OK button to save the Batch Processing dialog settings into the analysis template used(only available since Origin 2018b). The results will be outputted to Summary workbook as shown below:
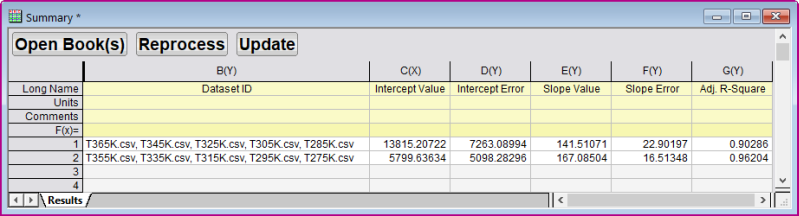
| Note the three buttons added to the top of the Output Sheet (Summary book, Results sheet):
- Open Book(s): If you enable Delete Intermediate Workbook (see step #3, above), then later decide you need them, you can highlight corresponding rows in the Results sheet and click this button to regenerate deleted books.
- Reprocess: Click this button to re-run import and update results when there have been changes to external data files.
- Update: Click this button to update results when something is changed on the input side of your analysis (e.g. masking of data in your data sheets).
|
|