6.12.12 3D Bar on Flatten Surface3D-Bar-FlatSurf
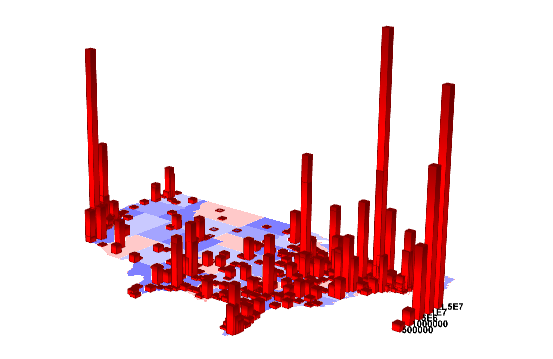
This graph is a combination of a flattened 3D surface of US Map with state divisions and 3D bars representing the city populations, the bars locate the longitude and latitude of the cities.
Minimum Origin Version Required: Origin 9.0 SR0
What you will learn
This tutorial will show you how to:
- Plot a flattened 3D surface.
- Add a 3D bar graph to an existing 3D surface graph.
Steps
This tutorial is associated with the Tutorial Data project:<Origin EXE Folder>\Samples\Tutorial Data.opj.
- Open the Tutorial Data project and browse to folder 3D Bar on Flat Surface in Project Explorer.
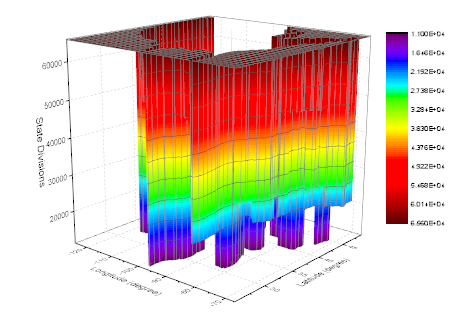
- Activate MBook1E, select Plot> 3D : 3D Colormap Surface from the main menu. A graph window will be generated.
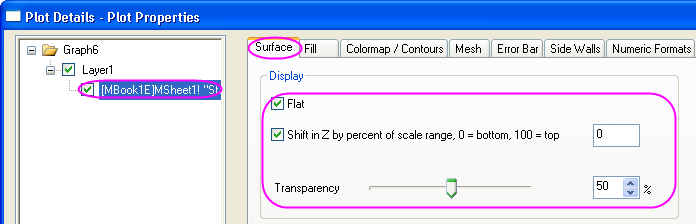
- Double-click on the graph to open the Plot Details dialog. In the Surface tab, check Flat and Shift in Z, set the Z offset to 0 and the Transparency to 50.
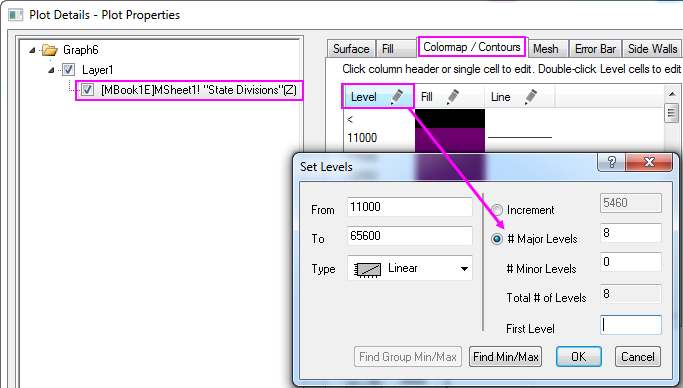
- Go to the Colormap/Contours tab, click on the Level... header to open the Set Levels dialog. In this dialog, set the Major Levels to 8, Minor Levels to 0.
- Click the OK button to close this dialog. Click on the Fill... header to open the Fill dialog. In the Fill dialog, select Load Palette, click Select Palette button to select Thermometer palette and uncheck the Link to Palette check box.
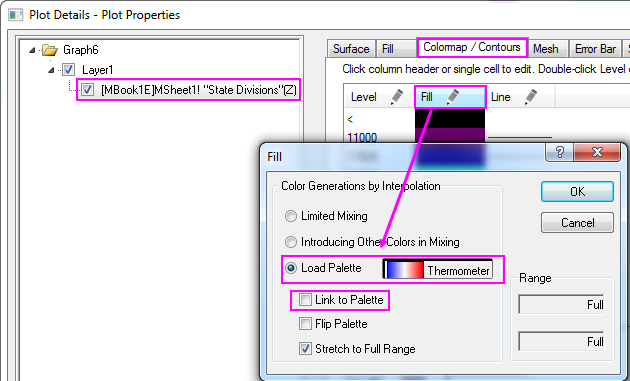
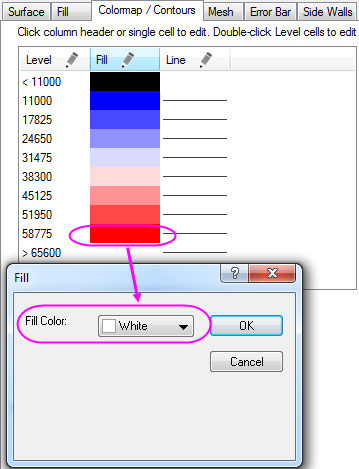
- Click OK button to close the Fill dialog. Click the fill cell of last level and set its color as White.
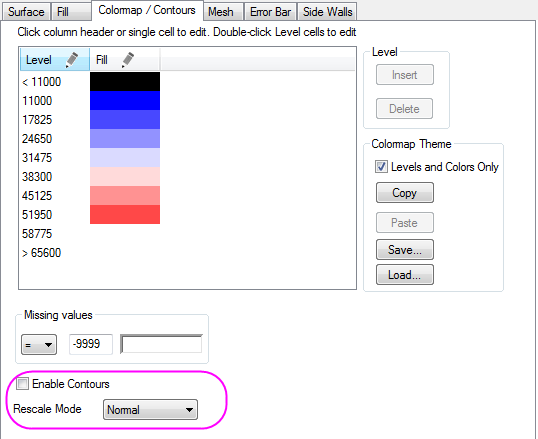
- Uncheck the Enable Contours in the Colormap/Contours tab.
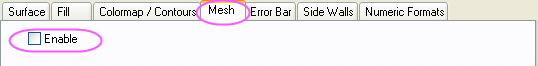
- Go to Mesh tab, uncheck the Enable check box.
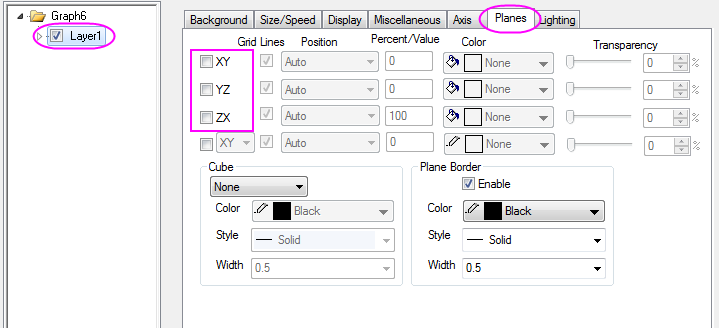
- Select Layer1 in the left panel, go to the Planes tab in the right panel. Uncheck the XY, YZ, and ZX check boxes.
- Click OK to close the Plot Details dialog. Right-click on the layer icon and choose Plot Setup from the menu. In the Plot Setup dialog, choose Worksheets in Folder for Available Data, 3D-Bars as Plot Type and USMetropolitan as the data source sheet. Set Longitude, Latitude, and Population as X, Y, Z respectively. Click Add to add the 3D bar graph to the current layer.
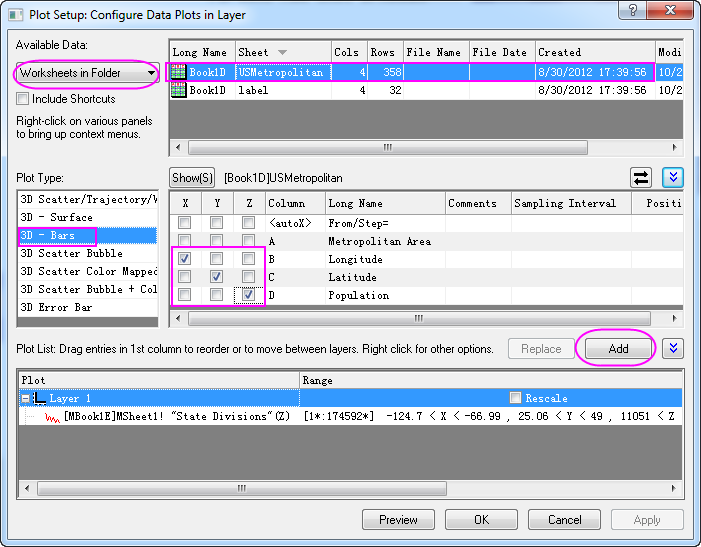
 | In order to show all three panels in Plot Setup dialog, please expand Plot Type panel by clicking  and expand Available Data panel by clicking again. and expand Available Data panel by clicking again.
Please refer to Plotting using Plot Setup for more information.
|
- Click OK to close the Plot Setup dialog. Select Graph: Rescale to Show All to rescale the graph.
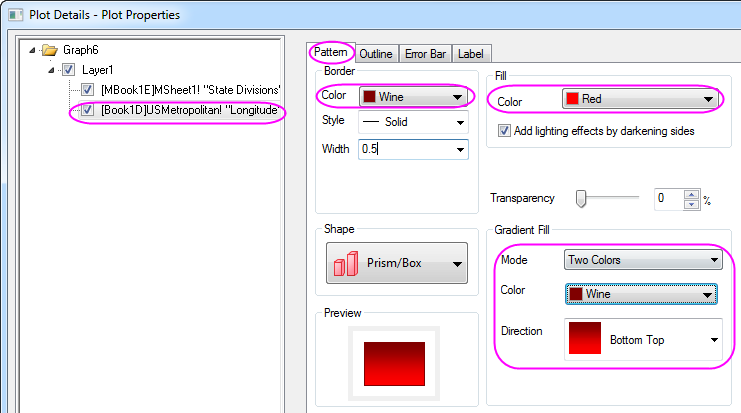
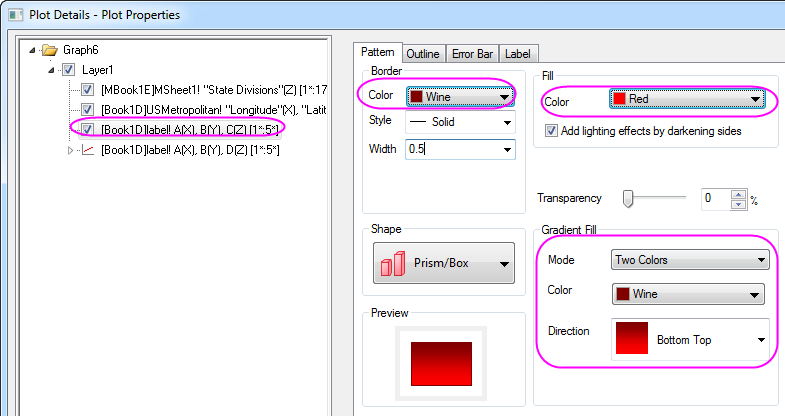
- Double-click on the 3D bar graph to open the Plot Details dialog. In the Pattern tab, set the color of Border and Fill as red, and set Gradient Fill as shown below.
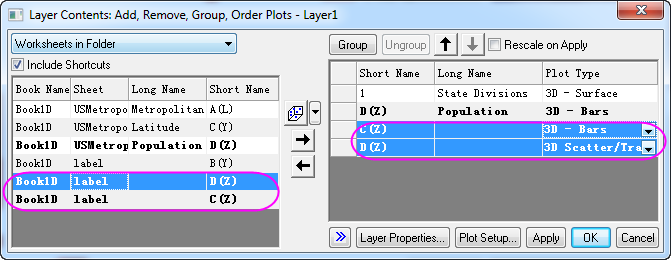
- Click OK to close the Plot Details dialog. On the graph window, right-click on the layer icon and select Layer Contents... from the context menu to open the Layer Content dialog. In this dialog, select Worksheets in Folder for the top-left drop-down list, add col(C) and Col(D) in Sheet Label as a 3D bar graph and a 3D scatter respectively to the current layer.
- Click OK to close the Layer Content dialog. Double-click on the 3D bar graph to open the Plot Details dialog. Select the third plot in the left panel, and go to the Pattern tab, apply the settings given below.
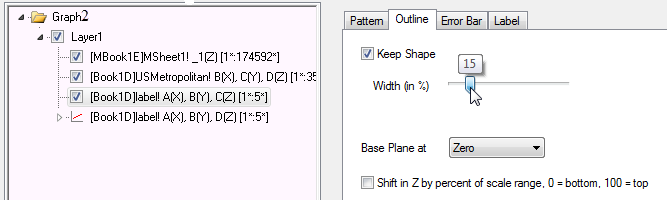
- Go to the Outline tab, set the Width(in%) to 15 as below.
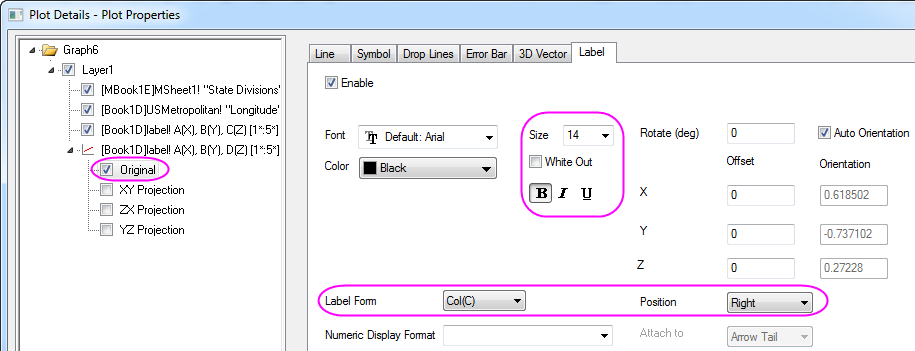
- Select the forth plot in the left panel, go to the Label tab and apply the settings below.
- Finally, you will get the graph shown below.
|