4.1.10 Using Multiple GadgetsUsing-Multiple-Gadgets
Summary
Multiple gadgets can be used in combination to achieve certain goals. To avoid overlapping of several gadget windows over same plot, we can arrange them into different layers to layout them onto different panels. The results from all other gadgets can be eventually added to the last gadget window and kept updated at each new output. In this tutorial, we will illustrate an example to show how we can combine the use of Quick Peaks, Quick Fit and Intersect gadgets to find the intersection point between the baseline and slope of a curve.
Minimum Origin Version Required: Origin 2016 SR0
What you will learn
This tutorial will show you:
- how to simultaneously use multiple gadgets to analyze same data.
- how to output Gadget analyzed results onto a specific graph and keep them updated.
- how to find the intersection point of baseline with the linear fitting of a curve.
Create a layout for multiple gadget windows
- Start with a new workbook and import the file \Samples\Curve Fitting\Gaussian.dat.
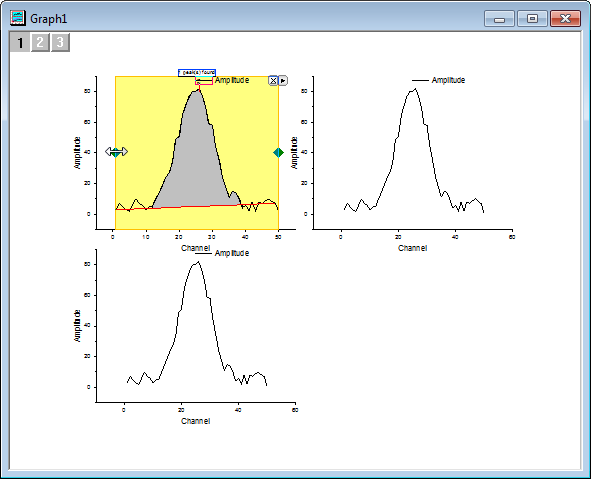
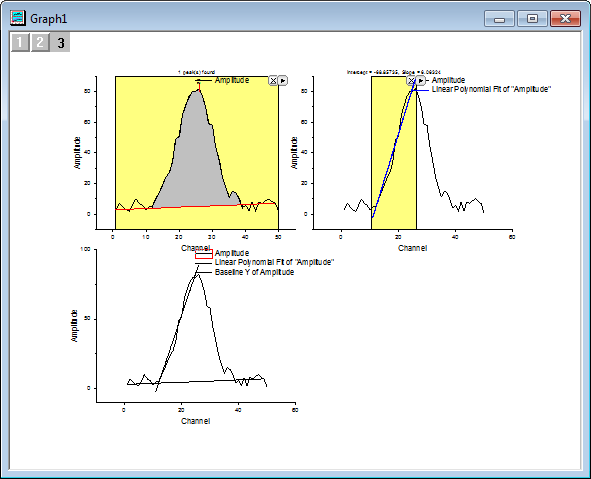
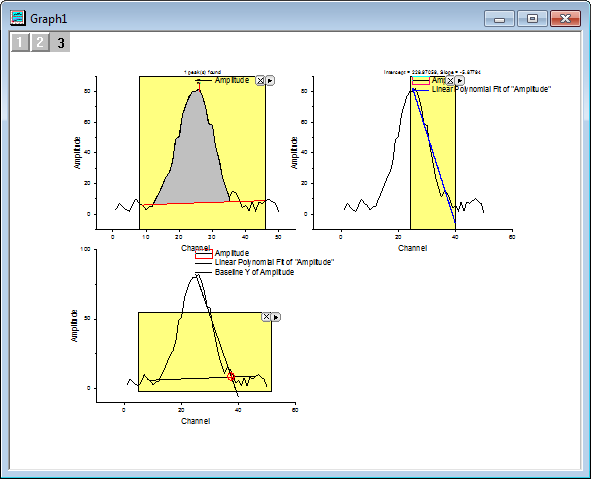
- To avoid overlapping the gadgets in one graph, we are going to prepare a multi-layer graph as shown below with same data in each layer.
- Click and select the second column and use the menu item Plot:Multi-Curve:4 Panel to create a 4 panel plot.
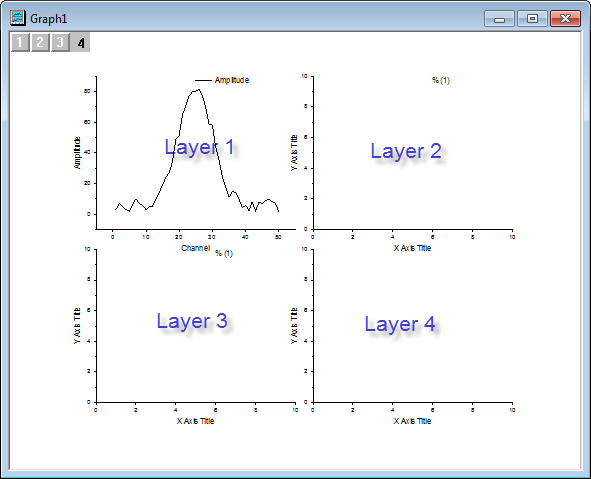
| Note: To make the explanation of following steps more clear, we marked above figure with blue font to help you distinguish the layers in the graph.
|
- Go back to the workbook, select the Amplitude column, and position the cursor at the edge of the column, until you see the cursor turn into
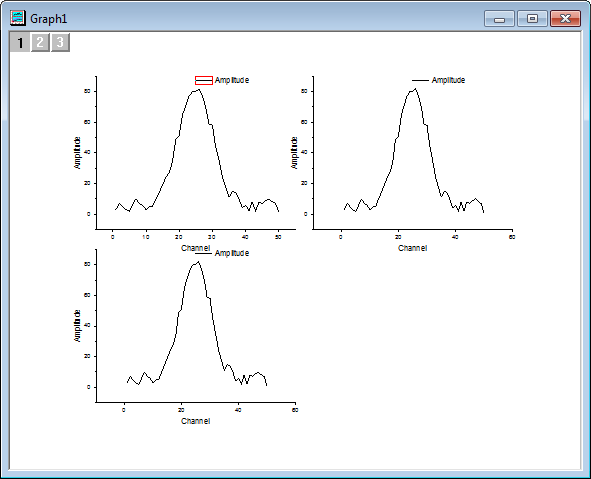
 . Then you can drag-and-drop the column into layer 2 on the graph page and click OK to close the appeared dialog box. Do it again to add the plot to layer 3 in the panel, and then click the bottom right area to select the unwanted layer 4 and use the Delete key on the keyboard to delete it. . Then you can drag-and-drop the column into layer 2 on the graph page and click OK to close the appeared dialog box. Do it again to add the plot to layer 3 in the panel, and then click the bottom right area to select the unwanted layer 4 and use the Delete key on the keyboard to delete it.
Using Quick Peaks gadget to find baseline
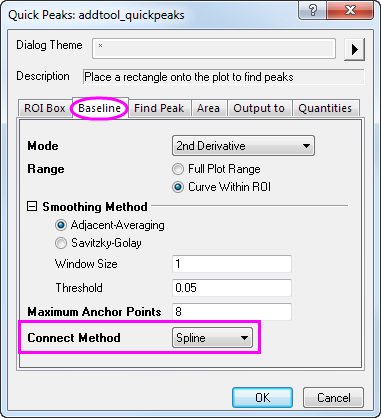
- Select Gadgets:Quick Peaks from the Origin menu when layer 1 is active to bring up the Data Exploration:addtool_quickpeaks dialog box. According to the lineshape of this curve, spline connection would be a better choice for fitting the baseline. To do so, go to the Baseline tab, choose Spline in the Connect Method drop-down list to connect anchor points with spline method.
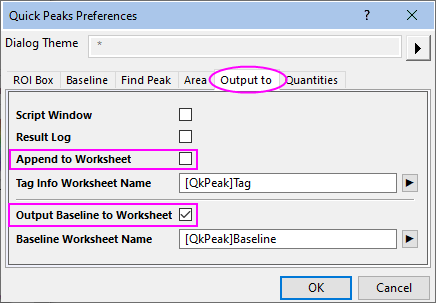
- Since we do not want to create new columns in the source sheet to save baseline data at every new output, we can save the result to a new workbook and the newly created baseline data will replace existing data instead. To do so, go to Output to tab, uncheck the Append to Worksheet box and check the Output Baseline to Worksheet to output baseline data into a new book QkPeak with sheet name as Baseline.
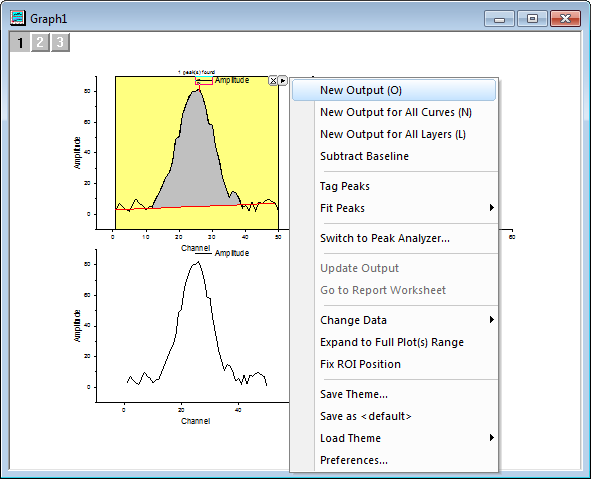
- Click OK to close the dialog box. Place the mouse cursor over the edge of the Region of Interest (ROI), when the cursor turns into a double arrow icon, you can resize the box as needed.
- Click the triangle button
 at the top right corner of the ROI to open the fly-out menu and choose New Output(O) to output baseline data. at the top right corner of the ROI to open the fly-out menu and choose New Output(O) to output baseline data.
Using Quick Fit to find the linear fit of the curve
- Activate the second layer by clicking on the layer icon
 on the top left corner of the graph or directly click on the plotting area of top right panel. on the top left corner of the graph or directly click on the plotting area of top right panel.
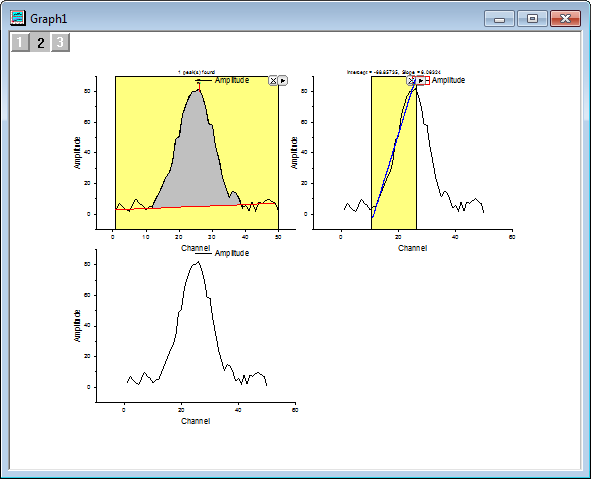
- Select Gadgets:Quick Fit:Linear(System) from the Origin menu to bring up the Quick Fit ROI, and adjust the position and range of appeared ROI properly to perform linear fitting over the left half of the peak envelope.
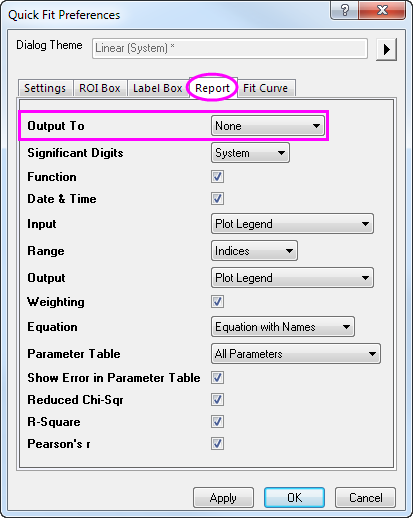
- Click the triangle button at the top right corner of the ROI to open the fly-out menu and choose Preferences to customize Quick Fit Preferences dialog box.
- Since we do not need other unnecessary output about this linear fitting, we can go to the Label Box tab, uncheck Add Label Box to Graph.
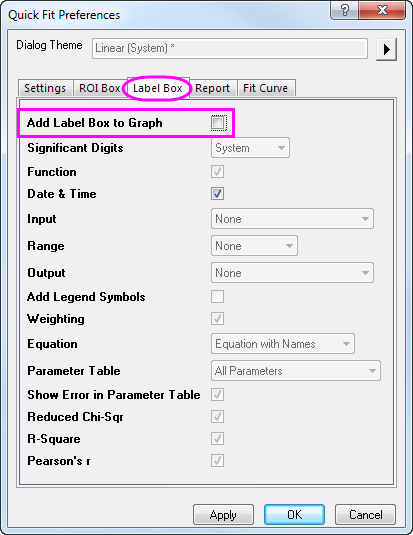
- For the same purpose, to avoid outputting summary report we can go to the Report tab, choose None in the Output To drop down list and click OK to close the dialog box.
- Return to the triangle button at the top right corner of the ROI, choose New Output(O) to output linearly fitted results to worksheet.
Using Intersect gadget to find intersection point
- Before we apply the Intersect gadget, the first step to do is to add the fitted baseline and linearly fitted line from last two gadgets to the third plot. To do so, click on the layer icon
 on the top left corner to activate layer 3. Right click on the layer icon to choose Layer Contents to bring up Layer Contents-Layer 3 window. Select the data with long name QuickFit Y1 and Baseline Y of Amplitude and add them to the right panel through the right arrow icon on the top left corner to activate layer 3. Right click on the layer icon to choose Layer Contents to bring up Layer Contents-Layer 3 window. Select the data with long name QuickFit Y1 and Baseline Y of Amplitude and add them to the right panel through the right arrow icon  . .
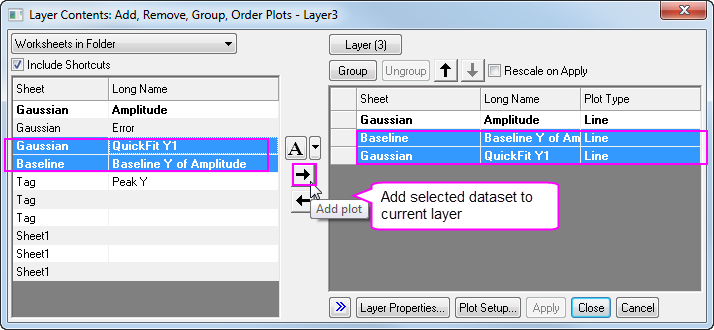
- Click OK to close the window and the fitted baseline and linear line will display in the third layer.
- Select Gadgets:Intersect from the Origin menu when layer 3 is active to bring up the Data Exploration:addtool_curve_intersect dialog box. Click OK to close the dialog box and it will bring up Intersect Gadget ROI.
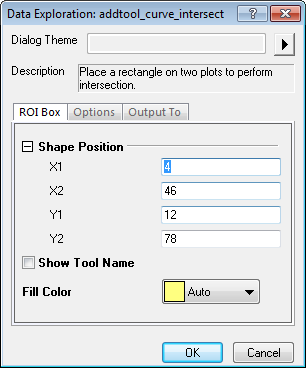
- Position and resize the ROI properly to have the intersection point between baseline and slope inside the box. To exclude other intersection points with the original curve, go to the triangle button at the top right corner of the ROI and uncheck Plot(1) Amplitude from the context menu of Change Data.
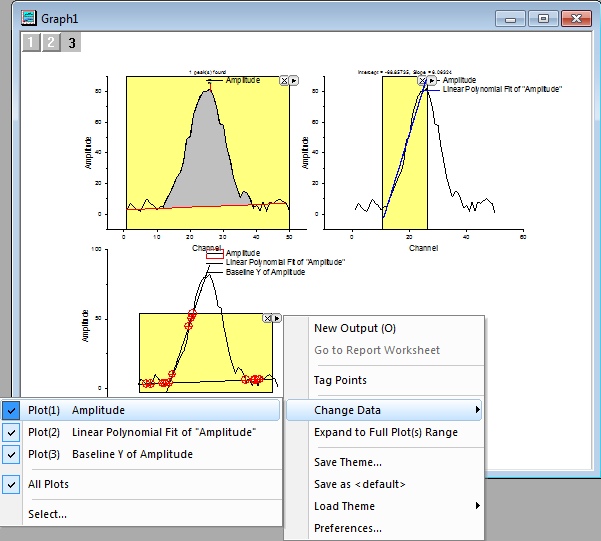
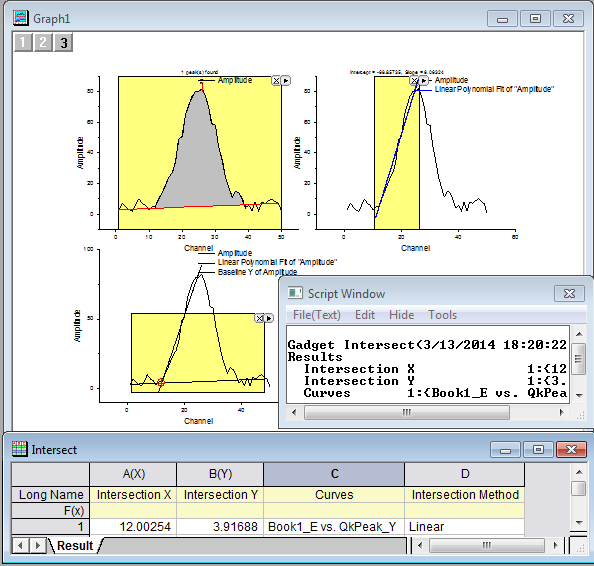
- Return to the triangle button at the top right corner of the ROI, choose New Output(O) to output the result of intersection point between baseline and linearly fitted line.
Update the output
- Click on the layer icon
 to activate layer 1, reposition Quick Peaks ROI to create a new baseline. Then go to the triangle button at the top right corner of the ROI, choose New Output(O) to output the newly created baseline. to activate layer 1, reposition Quick Peaks ROI to create a new baseline. Then go to the triangle button at the top right corner of the ROI, choose New Output(O) to output the newly created baseline.
- Click on the layer icon to activate layer 2, reposition Quick Fit ROI to the other side of the curve so it will create a new linear fit line. Then go to the triangle button at the top right corner of the ROI, choose Update Last Output(O) to output linearly fitted line result.
- Click on the layer icon to activate layer 3, reposition Intersect ROI to have the intersection point between newly created baseline and linearly fitted line inside the box. Then go to the triangle button at the top right corner of the ROI, choose New Output(O) to output the result of new intersection point.
|