9.3.3 Import Data from a Database for Analysis
Summary
 | The database used in this tutorial has been set up on Microsoft Azure.
|
This tutorial shows how to import data from database into Origin worksheet by using SQL Editor. And then perform some operations on the data, such as filter, statistics, etc., to get the desired results for the graphing.
The procedure is based on Origin 2023b.
What you will learn
This tutorial will show you how to:
- Import two SQL queries of same database into two sheets of a workbook data using SQL Editor.
- Apply data filter to the worksheet data.
- Perform descriptive statistics on columns.
- Make graphs such as column plot, etc.
Steps
Import Data from Database
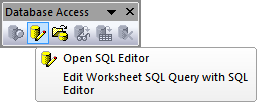
- Start a new project. Choose Data: Connect to Database: New... menu or click clicking the Open SQL Editor button on the Database Access toolbar.
- Choose Connection string radio button and click OK. Paste the Connection String below.
Driver={SQL Server}; Server=olab.DATABASE.windows.net; Port=1433;
DATABASE=sample1; Uid=Olabts; Pwd=Origin@2024;
If you are using ODBC Drive 18 for SQL Server, use
Driver={ODBC Driver 18 FOR SQL Server}; Server=olab.DATABASE.windows.net; Port=1433;
DATABASE=sample1; Uid=Olabts; Pwd=Origin@2024;;
- Click the Test button to test if the connection is fine. If fine, click the OK button to connection to the database.
- From the left panel, double click on the SalesLT.Product node. select * from SalesLT.Product will show on right
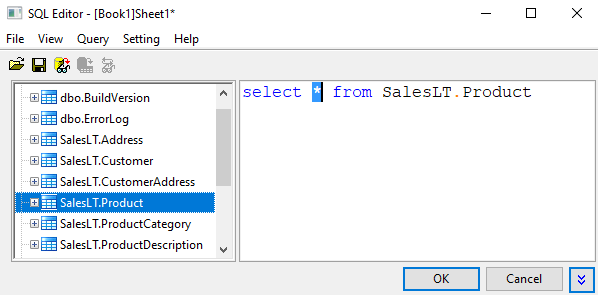
- Click the Preview the result data button
 to view the data in the bottom panel. to view the data in the bottom panel.
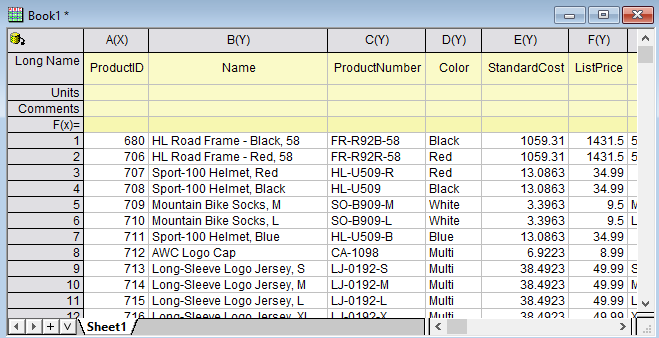
- Click the OK button to import the data to the active worksheet.
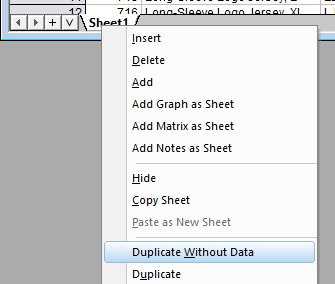
- To import data based on another SQL query from the same database to new sheet, right click the sheet tab and choose Duplicate Sheet without Data
- On Sheet2, click
 and choose SQL Editor... and choose SQL Editor...
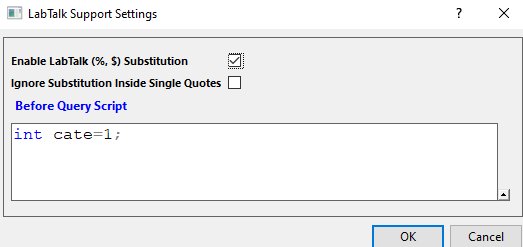
- Select Query: LabTalk... menu to open the LabTalk Support Settings dialog. Check the Enable LabTalk (%, $) Substitution checkbox, and put the following script to the text box.
int cate=1;
The dialog will look like this.
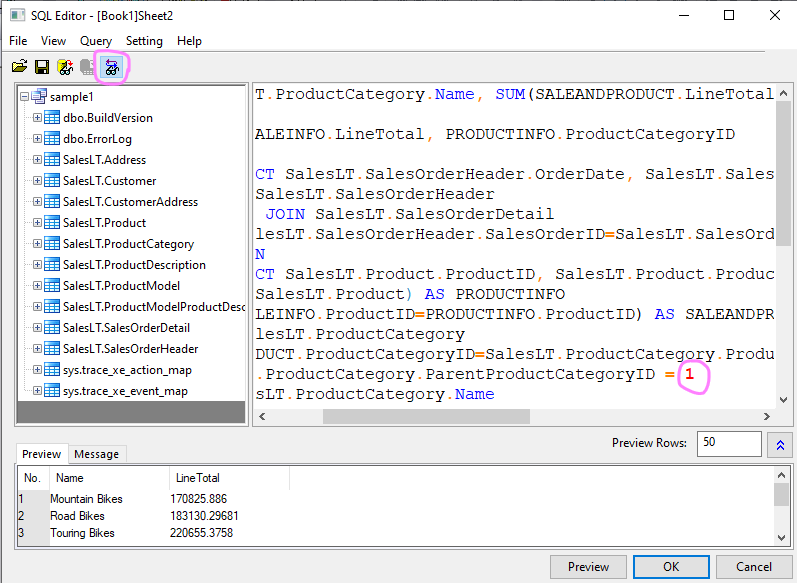
- Click OK to go back SQL Editor. Then put the following SQL script to the top right panel. This SQL will query two columns from the database, one is the product's category name, the other is the total of LineTotalfor each category in Parent Category 1
SELECT SalesLT.ProductCategory.Name, SUM(SALEANDPRODUCT.LineTotal) AS LineTotal
FROM
    (SELECT SALEINFO.LineTotal, PRODUCTINFO.ProductCategoryID
    FROM
        (SELECT SalesLT.SalesOrderHeader.OrderDate, SalesLT.SalesOrderDetail.LineTotal, SalesLT.SalesOrderDetail.ProductID
        FROM SalesLT.SalesOrderHeader
        INNER JOIN SalesLT.SalesOrderDetail
        ON SalesLT.SalesOrderHeader.SalesOrderID=SalesLT.SalesOrderDetail.SalesOrderID) AS SALEINFO
    INNER JOIN
        (SELECT SalesLT.Product.ProductID, SalesLT.Product.ProductCategoryID
        FROM SalesLT.Product) AS PRODUCTINFO
        ON SALEINFO.ProductID=PRODUCTINFO.ProductID) AS SALEANDPRODUCT
INNER JOIN SalesLT.ProductCategory
ON SALEANDPRODUCT.ProductCategoryID=SalesLT.ProductCategory.ProductCategoryID
WHERE SalesLT.ProductCategory.ParentProductCategoryID = $(cate)
GROUP BY SalesLT.ProductCategory.Name
ORDER BY LineTotal
- Click the last button
 to view the SQL query script with subsitudted variable. Click Preview the result data button to view the data in the bottom panel. to view the SQL query script with subsitudted variable. Click Preview the result data button to view the data in the bottom panel.
- Before closing the dialog, choose File: Save Connection and Query as .... Save it as LineTotal_by_parentCategory.ODQ.
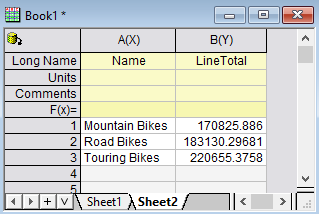
- Click the OK button. Query result shows on Sheet2
Data Filter and Statistics
- Instead of using SUM(), INNER JOIN, GROUP BY to get Statistics. We can first do simple query and import the columns we are interested. Then using Origin's filter and statistics, etc. to get desired result and graphing.
- Let's start a new book this time. E.g. Book2.
- Choose Data: Connect to Database: menu and pick LineTotal_by_parentCategory.ODQ.
- Replace the right with the following Query, which just inner join multiple tables and query 3 columns: Category Name, ParentCategoryID and LineTotal.
SELECT SalesLT.ProductCategory.Name ,SalesLT.ProductCategory.ParentProductCategoryID, SalesLT.SalesOrderDetail.LineTotal
FROM SalesLT.SalesOrderDetail
INNER JOIN  SalesLT.Product
ON SalesLT.SalesOrderDetail.productID = SalesLT.Product.ProductID
INNER JOIN SalesLT.ProductCategory
ON SalesLT.Product.ProductCategoryID = SalesLT.ProductCategory.ProductCategoryID
ORDER BY SalesLT.ProductCategory.ProductCategoryID
- Click the Preview the result data button to view the data in the bottom panel.
- Click the OK button to import the data to the active worksheet.
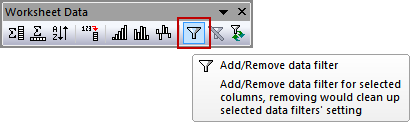
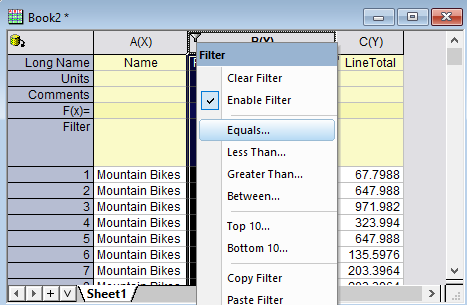
- Select column B (long name is ParentProductCategoryID), and then add a data filter to this column by clicking the Add/Remove data filter button on the Worksheet Data toolbar.
- Then there will be a filter icon on the top left corner of the column header. Click on it, and then select Equals... from the context menu.
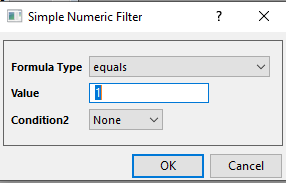
- There will be a dialog open, just keep the default Value to be 1 and click OK button.
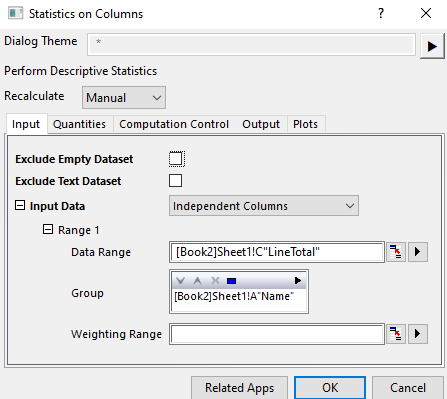
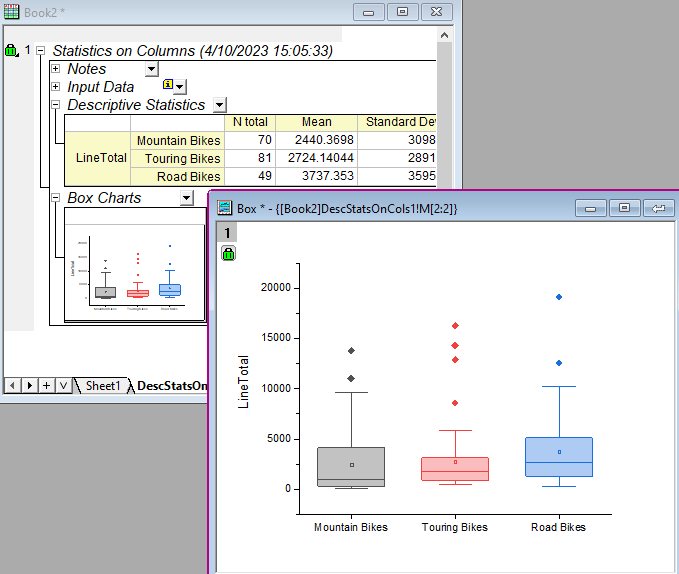
- Select column C (LineTotal), then select menu Statistics: Descriptive Statistics: Statistics on Columns to open the Statistics on Columns dialog.
- Click the > button to the right of Group to set column A to be the group column.
- Go to the Plots tab, check Box Charts checkbox.
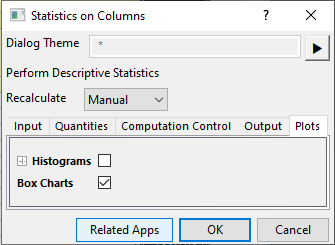
- Click OK button to get the results.
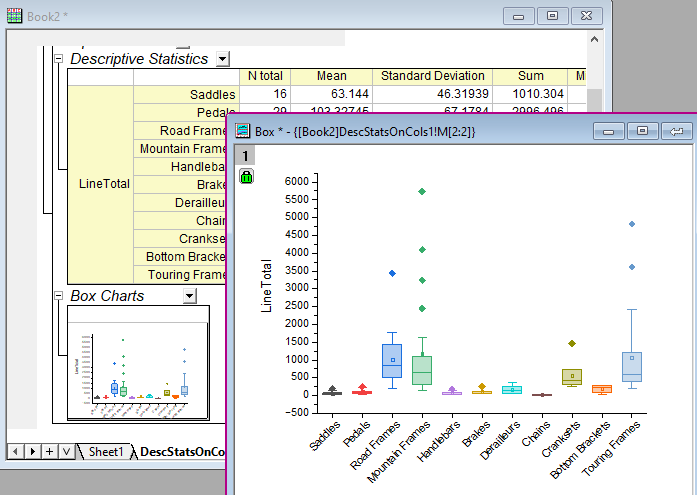
- It's very easy to change filter condition and get updated statistics. E.g. go back to Sheet1. Double click on =1 and change to =2
- Go to DescStatsOnCol1 sheet. The Recalculation lock turned yellow, meaning input changed. Click on it and choose Recalculate. Now the LineTotal of all products in parentCategoryID=2 shows.
 | You can click the Recalculation lock and set Recalculate Mode to Auto. When source data changes or filter changes, the statistics result will be updated automatically.
|
Radar Plot
- Statistics on Columns tool also generates a flat result sheet which we can use to do further analysis or graphing.
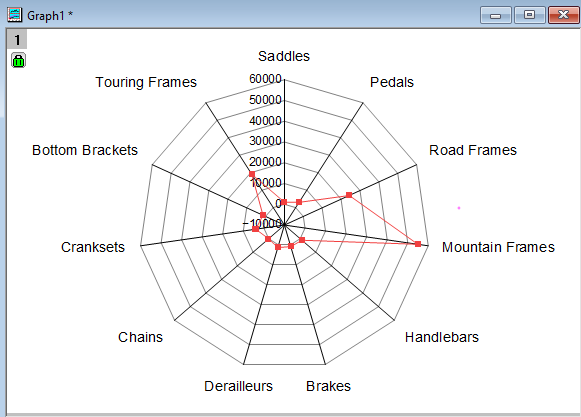
- Go to DescStatsQuantities1 sheet.
- Highlight column F (Sum) and select Plot: Specialized: Radar menu to make a radar plot.
- Go back to DescStatsQuantities1 sheet and add filter on column B (Name) and exclude Mountain Frames, Road Frames and Touring Frames. Rescale the Axis to see more details of products with smaller sum of LineTotal values.
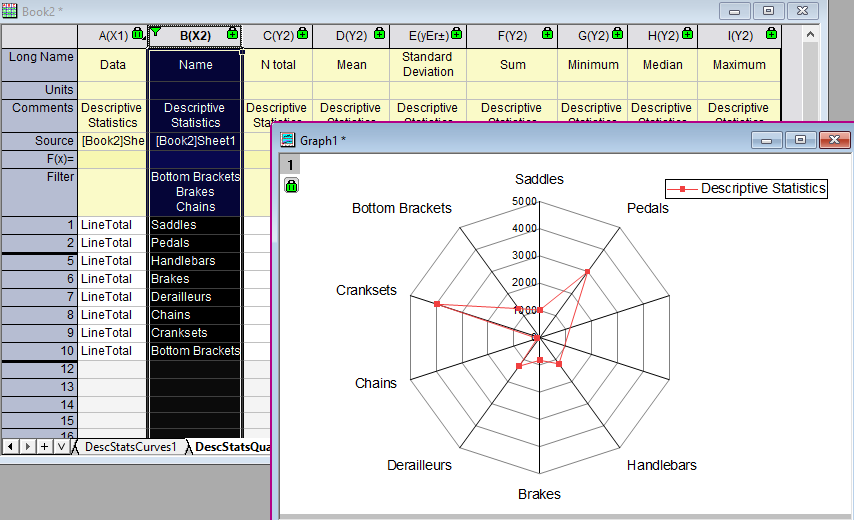
|