3.9.13 @Options in Substitution NotationOptions-Substitution-Notation
Label Option
This page builds a complete list of all available @options used in the %( ) String Substitution, which are used to do real-time subsitution of various bits of information, including plot/worksheet metadata, workbook, sheet info, predefined variables, and special cell value, etc.
They can be used in many places including axis titles, legend, text labels and in many dialog. The Examples section at the bottom shows some usage in places other than the typical legend, axis title and text label on graph. For their usage in legend, axis title and text labels, please refer to following pages:
List of @Options
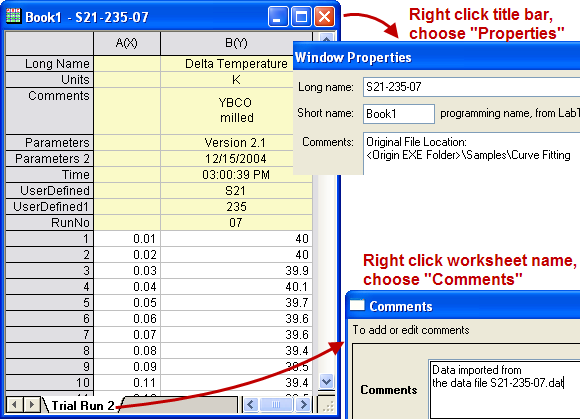
Below tables of available @ text-label options in %( ) substitution notation. %(1) used in many examples to refer to 1st plot in graph since most %( ) substitution notations are used on graph to access plot's corresponding data's metadata, worksheet, workbook information such as the image below. Note: %(1Y) refers to 1st plot's Y data. %(?) refers to current plot. %H refers to current window.
Column Label Rows
| @ Option
|
Substitute Text From..
|
Example
|
| @LS / @C
|
Column Short Name
|
%(1,@LS) --> B
%(1,@C) --> B
|
| @LA
|
Long Name, if available, else Short Name.
|
%(1,@LA) --> Delta Temperature
|
| @L / @LL
|
Long Name, will return to missing value if long name does not exist. Equivalent to @LL.
|
%(1Y,@L) --> Delta Temperature
%(1,@LL) --> Delta Temperature
|
| @LG / @U
|
Long Name (if not available then Short Name) and Units (if present). Equivalent to @LG
|
%(1,@LG) -->Delta Temperature (K)
%(1,@U) -->Delta Temperature (K)
|
| @LC
|
Comments, if available, else Long Name, otherwise Short Name
|
%(1,@LC) -->
YBCO
milled
|
| @LC[n]
|
The nth line of the Comments label row cell. Note that n is optional and that @LC1 = @LC.
|
%(1,@LC2) -->milled
|
| @LM
|
1st line of Comment, if available, else Long Name, otherwise Short Name.
|
%(1,@LM) --> YBCO
|
| @LN
|
1st line of Comments (if not available then Long Name, otherwise Short Name) and Units. Equivalent to @(@LM(@LU)).
|
%(1,@LN) --> YBCO(K)
|
| @LU
|
Units
|
%(1,@LU) --> K
|
| @LUP,@LUS,@LUA,@LUC
|
Add brackets to Units. Parentheses = (), Square brackets = [], Angle brackets = <>, Curly brackets = {}
|
%(1,@LUA) --> <K>
|
| @LD
|
The first user-defined parameter
|
%(1,@LD) -->'S21
|
| @LD[n]
|
The nth user-defined parameter. Note that n is optional and that @LD1 = @LD.
(2025)n=0 for the last user-defined parameter.
|
%(1,@LD2) -->235
|
| @LD"name"
|
The user-defined parameter of specified name.
|
%(1,@LD"RunNo")-->07
|
| @LF[n]
|
The filter condition of the data plot. When there are multiple conditions, optional n = the nth line of filter condition (list order shown in Filter label row cell). Also, see LabTalk system variable @SFD
|
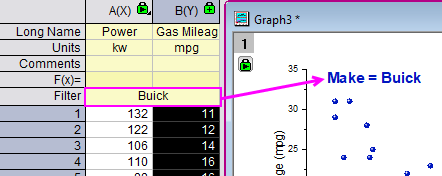
Make = %(1,@LF)-->Buick
|
| @LH
|
The name of the first User-Defined Parameter.
|
%(1,@LH) -->UserDefined
|
| @LH[n]
|
The name of nth User-Defined Parameter. Note that n is optional and that @LH1 = @LH.
(2025)n=0 for the last user-defined parameter.
|
%(1,@LH3) -->RunNo
|
| @LP
|
The first System Parameter.
|
%(1,@LP) --> Version 2.1
|
| @LP[n]
|
The nth System Parameter. Note that n is optional and that @LP1 = @LP.
|
%(1,@LP2) --> 12/15/2004
|
| @LQ
|
The first User-Defined Parameter and Units (if available).
|
%(1,@LQ) --> S21(K)
|
| @LQ[n]
|
The nth User-Defined Parameter and Units (if available). Differs from @LH by including Units. Note that n is optional and that @LQ1 = @LQ.
|
%(1,@LQ2) --> 235(K)
|
| @LQ"name"
|
The User-Defined Parameter (specified by name) and Units (if available).
|
%(1,@LQ"RunNo") --> 07(K)
|
Workbook Information
| @ Option
|
Substitute Text From..
|
Example
|
| @WL / @PL
|
Long Name of book
(workbook, matrix)
|
- %(1, @WL) -->S21-235-07 (for plot)
- %(1@W, @PL) -->S21-235-07 (for workbook with plot data)
- %(Book1, @PL) -->S21-235-07 (for given workbook)
|
| @W / @PN
|
Short Name of book
(workbook, matrix)
|
- %(1,@W) -->Book1 (for plot)
- %(1@W, @PL) -->Book1 (for workbook with plot data)
|
| @PC[n]
|
The nth line of the WorkBook Comment.
for @WC, if optional n is not specified, only the first line will be shown.
for @PC, if optional n is not specified, all the comments will be shown.
|
- %(1,@WC2) --><Origin EXE Folder>\Samples\Curve Fitting
- %(1@W, @PC) -->
Origin File Location
<Origin EXE Folder>\Samples\Curve Fitting
|
| @WS / @SN
|
Name of the sheet
(workbook, matrix)
|
- %(1, @WS) -->Trial Run 2 (for plot)
- %(1@W, @SN) -->Trial Run 2 (for worksheet with plot data)
- %([Book1]1, @SN) -->Trial Run 2 (for given worksheet)
|
| @WNL / @SNL
|
Long Name of sheet
(workbook, matrix)
|
|
| @WNS
|
Short Name of sheet
(workbook, matrix)
|
%(1,@WNS) -- See LabTalk System Variable @SSL
|
| @WM[n]
|
The nth line of the WorkSheet Comment. If optional n is not specified, only the first line will be shown.
|
%(1,@WM) -->Data imported from
|
| @WN
|
The contents of the cell Note.
|
- %(1,@WN,1)
- Content of Note in source column of 1st plot, row[1].
- %(1,@WN,B,3)
- Content of Note in col(B), row[1] in current plot's data sheet.
- %(1,@WN,C)
- Content of Note in source column's Comment Cell.
- %(1,@WN,B,L)
- col B LN Cell Note in current plot's data sheet
- %([book1]1,@WN,col(B)[L])
- col B LN cell Note in given sheet
|
| @WP
|
Project Explorer (PE) path of the book
(workbook, matrix)
|
%(1,@WP) -->/Folder1/
|
Worksheet Column Information
| @ Option
|
Description
|
Example
|
| @#
|
Returns the total number of columns in worksheet.
|
- Column number in the worksheet with plot data
- Column number in the given sheet
|
| @CS
|
Returns the column index of the first selected column to the right of (and including) nth column. Return 0 if not found
|
- Column index of the selected column in the worksheet with plot data
- %([Book1]1, @CS, 1) --> 2
- Column index of the selected column in the given sheet
|
| @E#
|
If argument = 1, returns the number of Y error columns in the worksheet. If argument = 2, returns the number of Y error columns in the current selection range. If argument is omitted, it's assumed to be 1.
|
- Number of Y error columns in the worksheet with plot data
- %([Book1]1, @E#, 2) --> 0
- Number of Y error columns in the given sheet
|
| @H#
|
If argument = 1, returns the number of X error columns in the worksheet. If argument = 2, returns the number of X error columns in the current selection range. If argument is omitted, it's assumed to be 1.
|
- Number of X error columns in the worksheet with plot data
- %([Book1]1, @H#, 2) --> 0
- Number of X error columns in the selection of given sheet
|
| @OY / @OYY
|
Returns the offset from the 1st selected Y column to the nth Y column to its right in selection. The nth Y must be in selection as well.
|
- Ctrl + select two Y column in the worksheet with plot data, returns offset of these two Y columns.
|
| @OYX
|
Returns the offset from the left-most selected Y column to the n+1th selected X column to its right in selection. The nth X must be in selection as well.
|
- Ctrl + select two pair of XY columns in the worksheet with plot data, returns offset of 2nd X column and 1st Y column
|
| @SCn
|
Returns the nth row of worksheet comments. If n is skipped, it's the 1st row of comments
|
|
| @X
|
Returns the column index of the first X column in worksheet
|
- %(1@W, @X) --> '1
- %([Book1]1, @X) --> '1
|
| @Xn
|
Returns the column short name of the first X column in worksheet.
|
- %(1@W, @Xn) --> 'A
- %([Book1]1, @Xn) --> 'A
|
| @Y-
|
Returns the column index of the closest Y column to the left of nth column. Returns 0 if not found.
|
- %(1@W, @Y-, 2) --> 2
- %([Book1]1, @Y-, 2) --> 2
|
| @Y#
|
If argument = 1, returns the number of Y columns in the worksheet. If argument = 2, returns the number of Y columns in the current selection range. If argument is omitted, it's is assumed to be 1.
|
- Number of Y columns in the worksheet with plot data
- Number of Y columns in the selection
- %([Book1]1, @Y#, 1) --> 3
- Number of Y columns in the given worksheet
|
| @Y+
|
Returns the column index of the closest Y column to the right of nth column. Returns 0 if not found.
|
- %(1@W, @Y+, 1) --> 2
- %([Book1]1, @Y+, 2) --> 3
|
| @YS
|
Returns the column index of the first Y column in selection range to the right of (and including) the nth column.
|
- %(1@W, @YS, 1) --> 2
- %([Book1]1, @YS, 1) --> 2
|
| @Z#
|
If argument = 1, returns the number of Z columns in the worksheet. If argument = 2, returns the number of Z columns in the current selection range. If argument is omitted, it'ss assumed to be 1.
|
- Number of Z columns in the worksheet with plot data
- Number of Z columns in the selection
- %([Book1]1, @Z#, 1) --> 0
- Number of Z columns in the given worksheet
|
Worksheet Cell Access
| @ Option
|
Substitute Text From..
|
Example
|
| @L, n
|
The X value of the nth point in the data plot.
|
%(1, @L, 2)
- means the X value of the 2nd data point in the 1st data plot.
|
| @V, n
|
The Y value of the nth point in the data plot.
|
%(1, @V, 2)
- means the Y value of the 2nd data point in the 1st data plot.
|
| @WT, ColIndex/ColName, RowIndex[, Format]
|
The sheet cell value specified by the column index (or short name) and row index.
|
%(1, @WT, 2, 3)
- the cell value at column 2, row 3 in the source sheet (worksheet, matrix) of the 1st data plot.
$( %(1, @WT, 2, 3,.4 ) * 100, .2 )
- Because it's numeric, get column 2, row 3 value, keep 4 decimal places, times by 100, then format to show 2 decimal places
%(1, @WT, B, 3)
- the cell value at column B, row 3 in the source worksheet of the 1st data plot.
|
| @WT, ColIndex/ColName, ColLabelRowCharacter[, Format]
|
The worksheet cell value specified by the column index (or short name) and column label row character.
|
%(1, @WT, B, C)
- Similar to B[C]$, this will get the Comment from column B, in the source worksheet of the 1st data plot.
|
Imported File Information
| @option
|
Substitute Text From...
|
Example
|
| @W, UserVar$
|
The user variables extracted during import wizard workbooks. UserVar is the name of the user variable
|
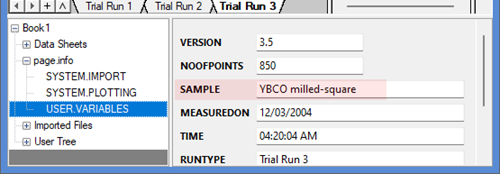
- %(1, @W,SAMPLE$) -->YBCO milled-squared
- %(Book1, @W,SAMPLE$) -->YBCO milled-squared (for given workbook)
|
| @W, NodeName$, [format]
|
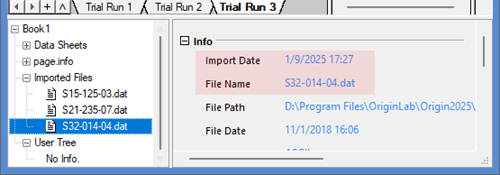
Returns the information in NodeName under page.info or User Tree in the Workbook Organizer.
|
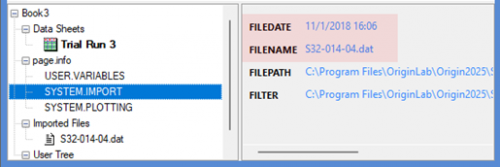
- %(1@W, @W,system.import.filedate, D0) -->11/1/2018
- %(1@W, @W,system.import.filename$)-->S32-014-04.dat
- %(Book1, @W,system.import.filename$)-->S32-014-04.dat (for given workbook)
|
| @WFn, NodeName$, [format]
|
Returns the information in vNodeName under the nth Imported Files in the Workbook Organizer.
|
- %(1@W, @WF3, Info.ImportDate, D0) -->1/9/2025
- %(1@W, @WF3, Info.FileName)-->S32-014-04.dat
- %(Book1, @WF3, Info.FileName)-->S32-014-04.dat (for given workbook)
|
| @WS, NodeName$, [format]
|
Returns the information in NodeName of the nth sheet under Data Sheets in the Workbook Organizer. No need to specify Column.
|
- %(1@W, @WS, TREE.INFO.UNIT$)
- %(Book1, @WS, TREE.INFO.UNIT$)(for given workbook)
|
| @WC, NodeName$, [format]
|
Returns the information in NodeName of User Tree at the column level, which can be seen in the Column Properties dialog.
|
- %(1Y, @WC, tree.ColumnInfo.ImportFile$)
- %([Book1]3!D, @WC, tree.ColumnInfo.ImportFile$)(for given workbook)
|
Plot Information
| @ Option
|
Substitute Text From..
|
Example
|
| @F
|
Plot's statistics such as mean, max, min, total, count, ...
|
%(1,@F"mean(this)") --> 120.45643
%(1,@F"mean(this)", .2) --> 120.46
- 1st plot's mean value. The optional , .2 is used to set display 2 decimal places
|
| @GF
|
Graph's filter condition.
Support %(L for page title, i.e %(L[n],@GF) where L for current layer and L2 for layer2
|
%(1,@GF) --> > 1996
|
| @GFN
|
Graph's filter condition with column name.
|
%(1,@GFN) --> Year > 1996
|
| @GG
|
Group Name of current plot in a graph
|
%(2, @GG)
- Show the group name of current plot. The default group name g# will show as blank.
|
| @GL
|
Layer Name of current plot in a graph
|
%(2, @GL)
- Show the layer name of current plot. The default layer name Layer# will show as blank.
|
| @L[n]
|
The information of current plot:
@L1: Plot Index
@L2: Group Name
@L3: Layer Name
|
%(1,@L1) --> 1
%(1,@L2) --> g1
%(1,@L3) --> Layer1
|
| @LX
|
Plot Designation Index.
When you have columns A(X1), B(Y1), C(X2) and D(Y2), plot then into a graph, you can use @LX to get the desinagtion index and show 1, 2 in the legend text.
|
%(1,@LX) --> 1
|
| @V"above"/@V"below"
|
Use in Fill Area Under Curve graph only. When Fill to next data plot - Above Below Color is selected, this notation is used for labels to indicate the filled-color above / below base curve.
|
%(1, @V"above")
%(1, @V"below")
-->
Above B
Below B
|
Dataset/Range Information
| @ Option
|
Substitute Text From..
|
Example
|
| @D
|
Dataset name
|
%(?Y,@D) --> Book1_B
|
| @R
|
Dataset range
|
%(1,@R) -->
[Book1]"Trial Run 2"!Col("Delta Temperature")[1:32]
|
| @R1
|
Dataset range without row index
|
%(1,@R1) -->
[Book1]"Trial Run 2"!Col("Delta Temperature")
|
| @RB
|
Starting row index of the plotted data
|
%(1,@RB) -->
1
|
| @RE
|
Ending row index of the plotted data, same as @RN if @RB is 1
|
%(1,@RE) -->
32
|
| @RN
|
Total number of rows in the plotted data (will not exclude missing values or masked data points)
|
%(1,@RN) --> 32
|
Holder Book Information
| @ Option
|
Substitute Text From..
|
Example
|
| @PLE
|
Holder Book Long Name. Returns the Long Name of container workbook for embedded Graph, Matrix, Notes or HTML Report.
|
%(%H,@PLE)
|
| @SC
|
Holder Sheet Comment. Returns the Comment of sheet for an embedded Graph, Matrix, Notes or HTML Report.
|
%(%H,@SC)
|
| @SN
|
Holder Sheet Display Name; if Label exists use Label. Returns the Display Name or Label of sheet for an embedded Graph, Matrix, Notes or HTML Report.
|
%(%H,@SN)
|
| @SNL
|
Holder Sheet Label. Returns the Label of sheet for an embedded Graph, Matrix, Notes or HTML Report.
|
%(%H,@SNL)
|
| @SNS
|
Holder Sheet Name. Returns the Name of sheet for an embedded Graph, Matrix, Notes or HTML Report.
|
%(%H,@SNS)
|
Note: When units are displayed in the substituted texts, the English and Japanese versions of Origin enclose the units in parentheses ( ), while the
German version will use square-brackets [ ].
Examples
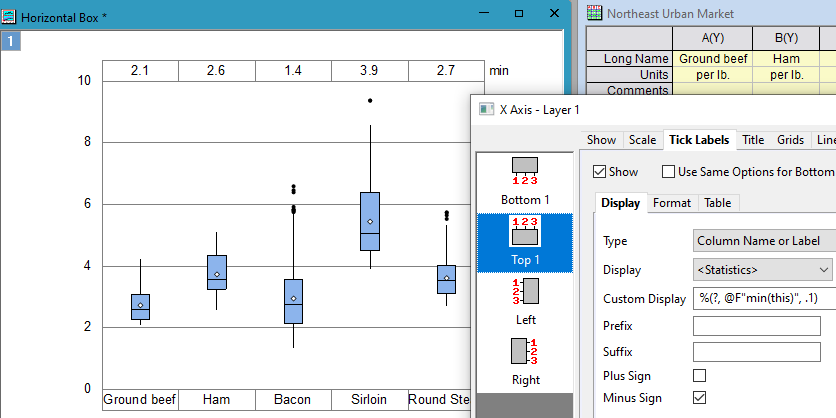
Show Statistics info. of Plot as Tick Labels
For Box chart, show minimum value with one decimal places for each plot as tick labels on top axis by %(?, @F"min(this)", .1).
Preset graph name in the template
Suppose we have many workbooks with same structure as below. We want to batch-plot these books from an existed graph and preset the graph Long Name as <workbook long name> - <Sample> for distinguishing. We can preset the graph name by %() notation when saving the template.
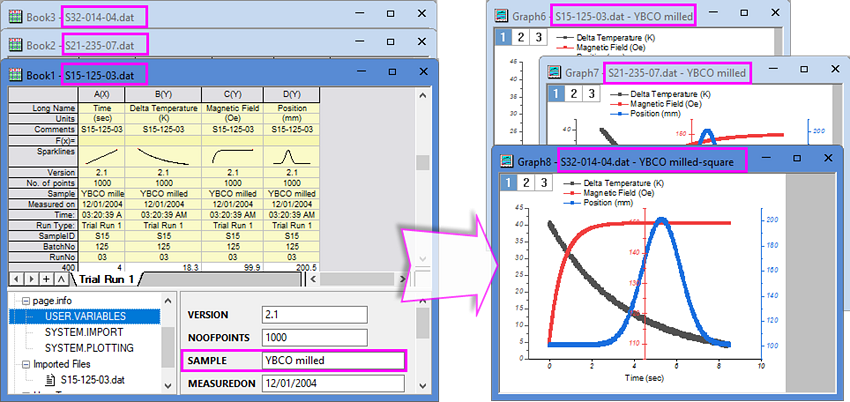
- After customization, right click on the graph window title to open the Save Template as dialog. Enter
%(1, @WL) - %(1, @W,SAMPLE$) in the Preset Graph Long Name box.
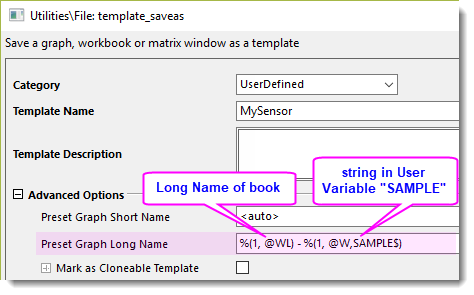
- When create graphs from the saved template, graphs Long Name will be constructed by workbook Long Name – string in user-defined parameter row "Sample".
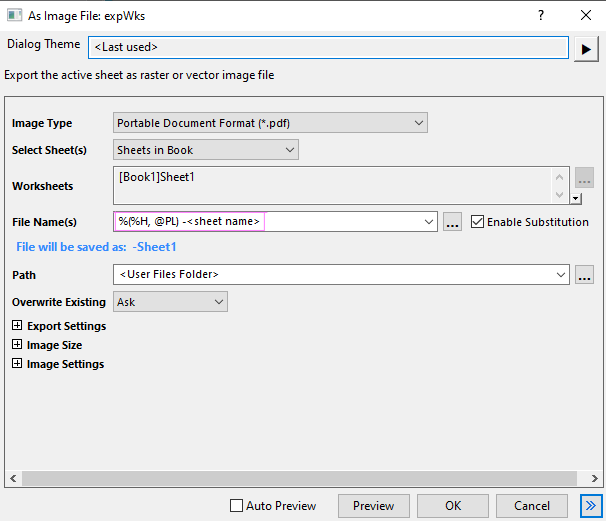
Export worksheet as PDF with Book and sheet name in File name
When using File: Export: As PDF File to export multiple sheets in a book with File Name(s) set to <long name>, PDF files names will be in [<book long name>]<sheet>.PDF format. Set File Name(s) to %(%H, @PL) - <sheet name>. The exported PDF file names will be in <book long name> - sheet name.pdf format.
Export embedded graph with Book and sheet name in File name
Suppose we collect all analysis related data and graphs in one workbook as below. We want to export the embedded graph to PowerPoint and attach the workbook and worksheet name as title line. We can preset it in the Send Graph to PowerPoint dialog.
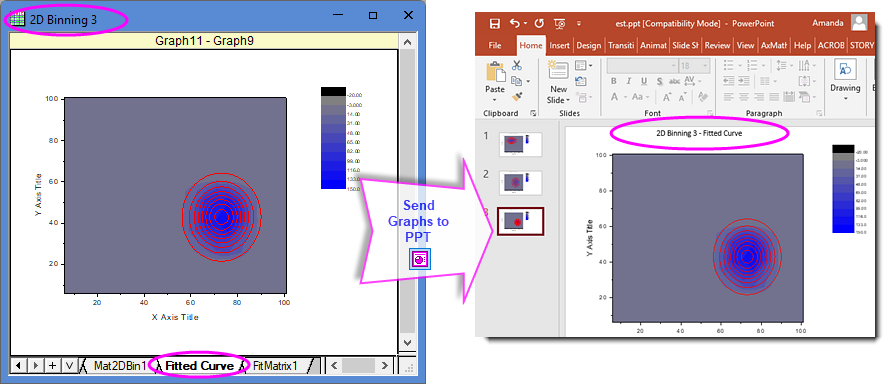
- Click the Send Graphs to PowerPoint button on the Standard toolbar. In the open dialog, choose Custom for Title and enter
%(%H, @PLE) - %(%H,@SN) in the text box.
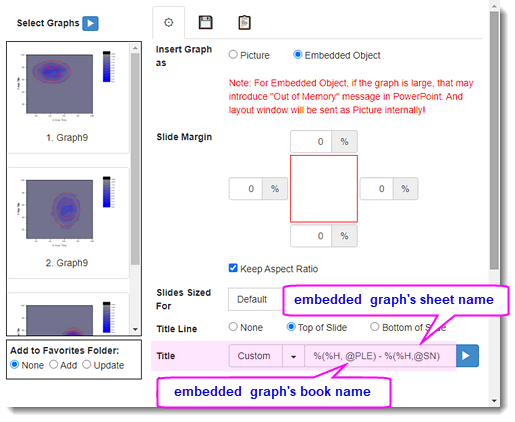
- The graphs sent to PPT should have title line such as "2D Binning 3 - Fitted Curve" on the top.
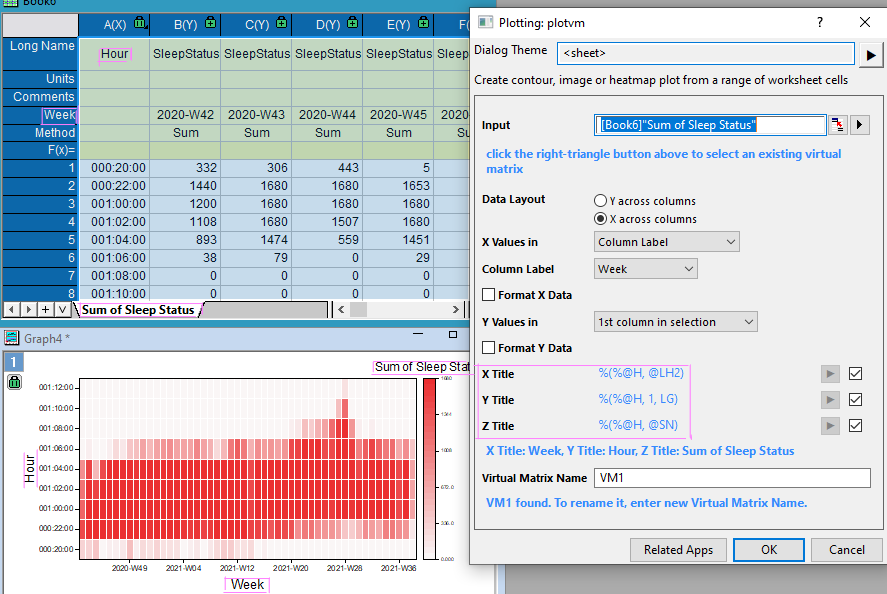
Preset X, Y, Z axis title when plotting Heatmap
When using data in worksheet as virtual matrix to plot heatmap or contour graph, X Title, Y Title and Z Title (used for color scale title) can be set based on X, Y info and worksheet name.
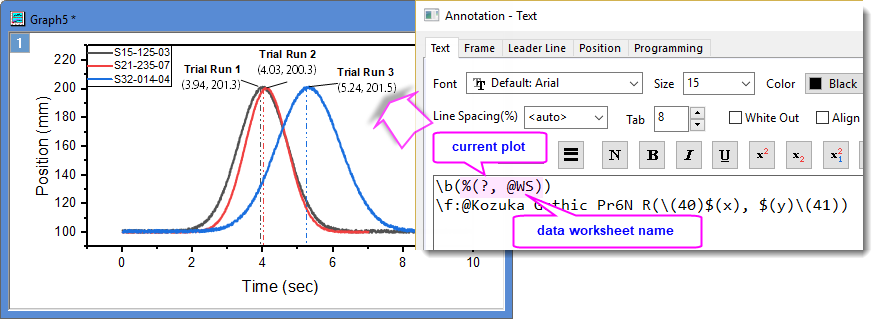
Annotate on Graph
When we use Annotation tool to label a data point, the auto-generated labels show XY coordinates by default. To add more information, e.g., worksheet name to the label, we can use
%(?, @WS)
to refer to it.
|