| |
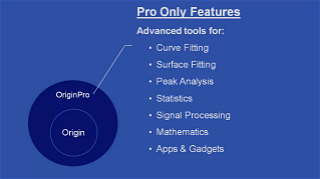
| OriginPro Video |
|
OriginPro offers advanced analysis tools and Apps for Peak Fitting, Surface Fitting, Statistics and Signal Processing. View this video to learn more.
|
| |
| New Apps for Origin 2016 |
|
We've published the following Apps in June.
  
To view all Apps, click here.
|
| |
| Tech Tip |
|
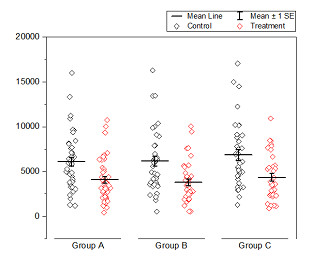
Plot Jitter Chart with Mean and SE Bar in Origin
Jitter chart, called column scatter in Origin, is a variation of vertical scatter plot which is often used to display individual data points.This blog will show how to customize a jitter chart to show mean line and SE error bars on top of it.
|
|
|
| |
| Origin 2016 Seminar in Rockville, MD |
|
Friday, July 28-29, 2016, 9AM - 5PM
Want to be an Origin expert? Attend the Origin 2016 Seminar to discover key graphing and analysis features! Seats are limited so Register Today!
|
| |
| Upcoming Events |
|
ACS Fall 2016 Aug 10-13, Booth #400
Pennsylvania Convention Center, Philadelphia, PA
Battery Show 2016 Sep 13-15 Booth #1656
Suburban Collection Showplace, Novi, MI
Neuroscience 2016 Nov 13-16 Booth #1536
San Diego Convention Center, San Diego, CA
MRS Fall 2016 Nov 29–Dec 01, Booth #TBD
Hynes Convention Center, Boston, MA
Please stop by our booth at these shows. We love to meet our users and learn more about how they are using Origin.
|
| |
| Contact with OriginLab |
|
Stay in Touch with OriginLab and other users:
    
Send your comments and suggestions to:
newsletter@originlab.com
For more information about OriginLab, visit:
www.OriginLab.com
Mailing Address:
OriginLab Corporation
One Roundhouse Plaza, Suite 303,
Northampton, MA 01060 USA
Tel: 1-413-586-2013
|
|