1.1.8 Creating a Gadget Tool with X-FunctionGadget Tool
Origin offers some gadgets that operate on graphs and matrices. You can find them in the Gadgets menu when a graph or matrix is active.
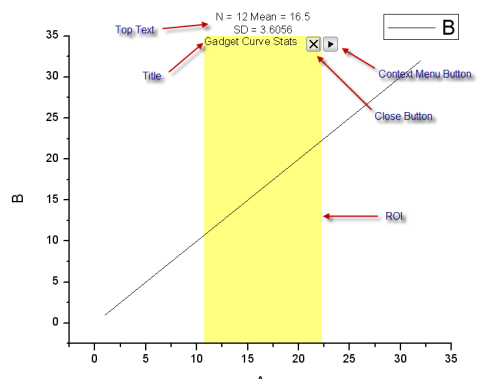
When you choose one of the gadgets, Origin adds a rectangle to the graph or matrix, allowing you to choose the region of data to be analyzed. After selecting the region of interest (ROI), you can open the context menu by clicking the  button and using the preference dialogs or themes to set up the analysis and output the results to desired destinations. button and using the preference dialogs or themes to set up the analysis and output the results to desired destinations.
Origin allows users to add a user-defined gadget tool with an X-Function, and then add this tool to the Origin Gadgets menu.
How to Create a Gadget
The following are the three main steps for creating a gadget tool:
- Create an X-Function.
The X-Function handles the dialog theme and adds the gadget tool to Origin's Gadget menu.
- Create an Origin C class derived from GraphObjCurveTool or MatObjROITool.
The GraphObjCurveTool and MatObjROITool classes are Origin C building classes and declared in the file:
OriginExeFolder\OriginC\Originlab\GraphObjTools.h
These classes are used to create a region of interest (ROI) object and provide default handling for events. Events include moving and resizing the ROI object and choosing items on the ROI context menu.
- Add event functions.
The name of the global event function needs to be in the xfname_events format, where xfname is the name of the X-Function. A function's argument list must use the following syntax:
void xfname_events(string strGrName, int nEvent, int nMsg = 0);
The next sections will explain these steps in more detail.
Creating an X-Function
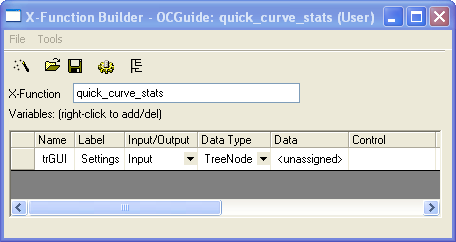
- With Origin active, press F10 to open X-Function Builder. Set up your new X-Function's name and variables as shown below.
- Click the
 button to save the X-Function. button to save the X-Function.
- Click the
 button to open the X-Function's source code in Code Builder. button to open the X-Function's source code in Code Builder.
- Add two additional include statements.
//put additional include files here
#include <..\Originlab\grobj_utils.h>
#include <..\Originlab\GraphObjTools.h>
- Find the function named quick_curve_stats_make_tree and replace it's body with the following code for creating a GUI tree.
X-Function, make_tree
if( 0 == strcmp(lpcszVarName, "trGUI") )
{
    GETN_USE(tr)
    GETN_OPTION_BRANCH(GETNBRANCH_OPEN) // default to open branch

    int nUserID = GET_USER_DATAID(0);
    int nBranchID = 1;

    GETN_STR(toolname, STR_TOOLNAME, "Quick Curve Stats")GETN_ID(nUserID++)
        // the option to add a checkbox control with editbox
        GETN_CONTROL_OPTION_BOX(1)
    GETN_COLOR(rectColor, "Rectangle Fill Color", SYSCOLOR_LTYELLOW) GETN_ID(nUserID++)
        GETN_COLOR_CHOICE_OPTIONS(COLORLIST_CUSTOM | COLORLIST_SINGLE)

    // quantities branch, for output result options
    GETN_BEGIN_BRANCH(quantities, "Quantities") GETN_ID(nBranchID++)
        GETN_OPTION_BRANCH(GETNBRANCH_OPEN|GETNBRANCH_CHECK_CONTROL)

        GETN_CHECK(dataname, "Dataset Name", true) GETN_ID(nUserID++)
        GETN_CHECK(n, "Total Number", true) GETN_ID(nUserID++)
        GETN_CHECK(sum, "Sum", true) GETN_ID(nUserID++)
        GETN_CHECK(mean, "Mean", true) GETN_ID(nUserID++)
        GETN_CHECK(sd, "Standard Deviation", false) GETN_ID(nUserID++)
        GETN_CHECK(se, "SE of Mean", false) GETN_ID(nUserID++)
    GETN_END_BRANCH(quantities) // the end of quantities branch

    // output branch, the options for output destination
    GETN_BEGIN_BRANCH(output, "Output To") GETN_ID(nBranchID++)
        GETN_CHECK(script, "Script Window", true) GETN_ID(nUserID++)
        GETN_CHECK(reslog, "Results Log", false) GETN_ID(nUserID++)
        GETN_CHECK(outputwks, "Output to Worksheet", false) GETN_ID(nUserID++)
    GETN_END_BRANCH(output) // the end of output branch
}
return 0;
- Click the
 button to compile your changes. After successfully compiling, click the button to compile your changes. After successfully compiling, click the  button to go back to X-Function Builder. button to go back to X-Function Builder.
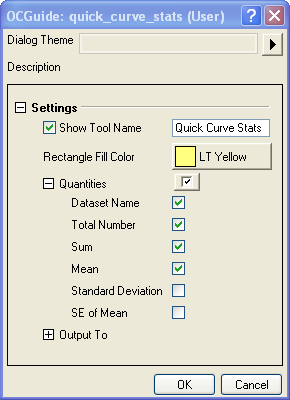
- Click the button to save the X-Function again, then close X-Function Builder.
- Run "quick_curve_stats -d" in the Command window. The following dialog will display.
Now you have your X-Function. In the next section we will show you how to define a new class derived from an Origin C building class.
Defining a Class Derived from GraphObjCurveTool
This section will show you how to define a new class derived from Origin C's GraphObjCurveTool class. The GraphObjCurveTool class will help handle most of the work for your new class.
The GraphObjCurveTool class is used when making a gadget that will operate on a graph. If you are making a gadget that will operate on matrix data then you would derive your class from the MatObjROITool class. Both GraphObjCurveTool and MatObjROITool are declared in the GraphObjTools.h header file.
- Open quick_curve_stats.XFC in Code Builder. Near the top of the file we will define our new class.
//put additional include files here
#include <GetNbox.h>
#include <..\originlab\grobj_utils.h>
#include <..\Originlab\GraphObjTools.h>

#define XF_NAME "quick_curve_stats"
#define TOOL_PREFERENCES_TITLE _L("Statistics")

class QuickCurveStatsTool : public GraphObjCurveTool
{
protected:
	string	GetXFName() { return XF_NAME; }
	string 	GetSignature() { return "xf_addtool_quick_curve_stats"; }
	string	GetPreferenceTitle(){ return TOOL_PREFERENCES_TITLE; }

	// Will rewrite this function in Adding Event Functions section below.
	bool DoOutput(bool bUpdateLastOutput, bool bMarkerOnly = false)
	{
		LT_execute("type -a");
		LT_execute("type DoOuput");
		return true;
	}
};
- Go to the X-Function's main function, and use the class defined above to create an ROI on the graph.
QuickCurveStatsTool curveTool();
int nErr = curveTool.Create(XF_NAME, 0, trGUI);
if(nErr)
{
    error_report("quick_curve_stats failed to Init!");
    return;
}
curveTool.ExpandFullRange();
- Activate a graph window with a curve, and run "quick_curve_stats -d" in the Command window. A rectangle with top text, a title and two mini buttons will be added on the graph.
Adding Event Functions
Basic global event function
- Open quick_curve_stats.XFC in Code Builder, and add the event function as below, after the line //put your own support static functions here
//put your own support static functions here
void quick_curve_stats_events(string strGrName, int nEvent, int nMsg = 0)
{
	QuickCurveStatsTool sTool;
	graphobjtool_events(sTool, strGrName, nEvent, nMsg);
}
- Run the X-Function, "quick_curve_stats -d", in the Command window and click the OK button to close the dialog. Click the button, attached to the ROI, to open the context menu. Click New Output, and DoOutput will be printed on the Script window. Choose Preference, and a dialog with the X-Function's settings will appear. Change the color in the Rectangle Fill Color control, and update the text in the Show Tool Name control in the opening dialog, then click OK. The fill color and title text of the rectangle will be changed.
Overload virtual event functions
Run this X-Function, "quick_curve_stats -d", in the Command window to add a ROI. If you move the ROI on a graph, the Origin status bar on the left will show the current x from/to values and the width of the ROI. The following three steps will show you how to overload the OnMove virtual method to refresh the ROI top text with the curve statistics results, on 'ROI moving'.
- Declare the following two methods in the QuickCurveStatsTool class.
protected:
	BOOL OnMove()
	{
		string strTopText = getResult();
		UpdateTopLabel(strTopText, true);
		return true;
	}
private:
	string getResult(TreeNode& trResult = NULL)
	{
		// Get the data in ROI selected
		vector vx, vy;
		GetData(vx, vy);

		// Calculate statistic on data
		int npts;
		double sum, mean, sd, se;
		vy.Sum(sum);
		if( 0 != ocmath_basic_summary_stats(vy.GetSize(), vy, &npts,
			&mean, &sd, &se) )
		{
			return "Error in calculation!";
		}

		// Get output options from GUI
		Tree trGUI;
		GetGUITree(trGUI);
		bool 	bDatasetName = trGUI.quantities.dataname.nVal,
				bPoints = trGUI.quantities.n.nVal,
				bSum = trGUI.quantities.sum.nVal,
				bMean = trGUI.quantities.mean.nVal,
				bSD = trGUI.quantities.sd.nVal,
				bSE = trGUI.quantities.se.nVal;

		string strDatasetName;
		if( bDatasetName )
		{
			m_dp.GetRangeString(strDatasetName);
		}

		// Put result to string
		string strText;
		string strNumDec = "*", strNextLine = "\r\n";
		if( bDatasetName )
			strText += "Dataset Name: " + strDatasetName + strNextLine;
		if( bPoints )
			strText += "N = " + npts + strNextLine;
		if( bSum )
			strText += "Sum = " + ftoa(sum, strNumDec) + strNextLine;
		if( bMean )
			strText += "Mean = " + ftoa(mean, strNumDec) + strNextLine;
		if( bSD )
			strText += "SD = " + ftoa(sd, strNumDec) + strNextLine;
		if( bSE )
			strText += "SE = " + ftoa(se, strNumDec) + strNextLine;
		strText.TrimRight(strNextLine);

		// Put result to tree
		if( trResult && trResult.IsValid() )
		{
			GETN_USE(trResult)
			if( bDatasetName )
			{
				GETN_STR(DatasetName, "Dataset Name", strDatasetName)
				GETN_CURRENT_SUBNODE.SetAttribute(STR_TYPE_ATTRIB,
					TNVAL_TYPE_CSTRING);
			}
			if( bPoints )
			{
				GETN_NUM(N, "Number of Points", npts)
			}
			if( bSum )
			{
				GETN_NUM(Sum, "Sum", sum)
			}
			if( bMean )
			{
				GETN_NUM(Mean, "Mean", mean)
			}
			if( bSD )
			{
				GETN_NUM(SD, "SD", sd)
			}
			if( bSE )
			{
				GETN_NUM(SE, "SE", se)
			}
		}

		return strText;
	}
- Run the X-Function to add a ROI on your graph. Move the ROI, and the top text will be updated with the current statistics results of the selected Y data.
- The following shows how to make the context menu items "New Output" and "Go to Report Worksheet" work. You need to overload the DoOutput and GetReportWorksheet virtual functions in the derived class QuickCurveStatsTool, and add a private function, acessBinaryInfo, to set and get the report worksheet name in the rectangle's binary storage. If you fail to get the report worksheet name from the rectangle, or the report worksheet name represents an invalid worksheet, the "Go to Report Worksheet" context menu item will be gray. Add the following methods to the QuickCurveStatsTool class.
protected:
	bool DoOutput(bool bUpdateLastOutput, bool bMarkerOnly = false)
	{
		Tree trGUI;
		GetGUITree(trGUI);

		// Get output result to string and treenode
		Tree tr;
		TreeNode trResult;
		if( trGUI.output.outputwks.nVal )
			trResult = tr.AddNode("Result");
		string strResult = getResult(trResult);

		// Output to Script window, optional
		if( trGUI.output.script.nVal )
		{
			LT_execute("type -a"); // to open Script window if closed
			LT_set_str("strResult$", strResult);
			LT_execute("type strResult$");
		}

		// Output to Result Log, optional
		if( trGUI.output.reslog.nVal )
		{
			Project.OutStringToResultsLog(strResult);
		}

		// Output to worksheet, optional
		if( trGUI.output.outputwks.nVal )
		{
			// To check output worksheet if already existed
			Worksheet wks;
			string strOutputWks;
			bool bCreateNew = true;
			if( acessBinaryInfo(true, strOutputWks) )
			{
				wks.Attach(strOutputWks);
				bCreateNew = !wks.IsValid();
			}

			// If it doesn't exist, you need to create a new one,
			// then put worksheet name into rectangle binary storage
			if( bCreateNew )
			{
				wks.Create(NULL, CREATE_HIDDEN);
				wks.SetSize(-1, 0);

				wks.GetRangeString(strOutputWks);
				acessBinaryInfo(false, strOutputWks);
			}
			out_tree_to_wks(trResult, wks);
		}
		return true;
	}

	BOOL GetReportWorksheet(Worksheet& wksReport)
	{
		string strWks;
		if( acessBinaryInfo(true, strWks) )
		{
			wksReport.Attach(strWks);
			return wksReport.IsValid();
		}
		return false;
	}

private:
	bool acessBinaryInfo(bool bGet, string& strInfo)
	{
		string strStorageName = "Info";
		Tree tr;

		if( bGet )
		{
			// To get output worksheet name from rectangle binary storage
			if( m_go.GetBinaryStorage(strStorageName, tr)
				&& tr.OutputWks
				&& !tr.OutputWks.IsEmpty() )
			{
				strInfo = tr.OutputWks.strVal;
				return true;
			}
			return false;
		}
		else
		{
			// Save output worksheet name to rectangle binary storage
			tr.OutputWks.strVal = strInfo;
			return m_go.PutBinaryStorage(strStorageName, tr);
		}
	}
- Prepare a graph with a data plot set as active, and run "quick_curve_stats -d" in the Command window to add a ROI. Move the ROI to an interesting area on the graph, open the context menu, and choose Preferences to open a dialog. Select all the check boxes in the Quantities and Output To branch, and click OK to close the dialog. Open the context menu again, and notice the Go to Report Worksheet menu item is gray. Click the New Output menu, and the result string will be outputted to a Script window and a Result Log, and a hidden worksheet will be created. Choose the Go to Report Worksheet menu, and the report worksheet displays. The columns in the worksheet hold the results.
|