6.9.3 Tile Grid Map from Base GraphTile-Grid-Map
Summary
This tutorial will show you how to create a tile grid map from base graph.
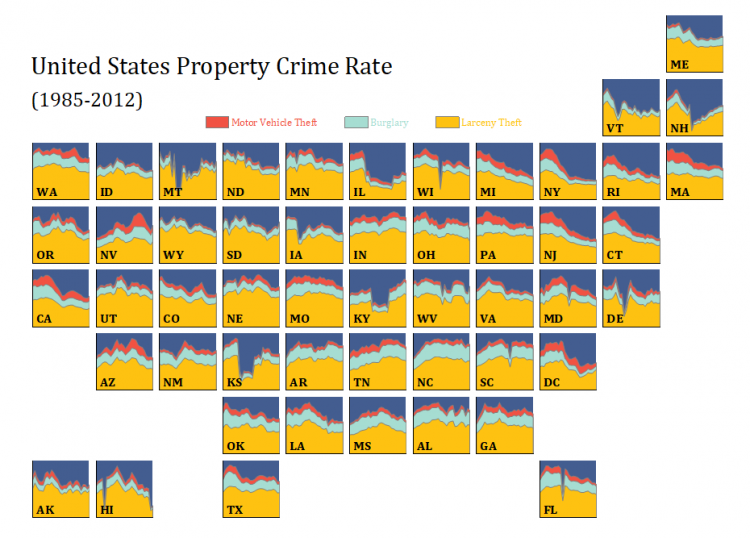
This is a US tile grid map for property crime rate of each states. Each tile are created from a base graph and represents an individual state.
What will you learn
This tutorial will show you how to:
- Prepare a base graph
- Create a tile grid map from the base graph
- How to obtain the arrangement data of tiles
Steps
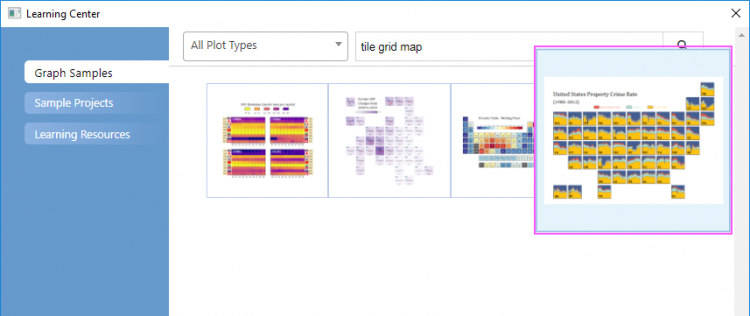
This tutorial is related to the sample project "Maps - Tile Grid Map for US Crime Rate" which can be found in Learning Center(select Help: Learning Center menu or press F11 key) by searching the keyword "tile grid map".
- Find and open the sample project in Learning Center.
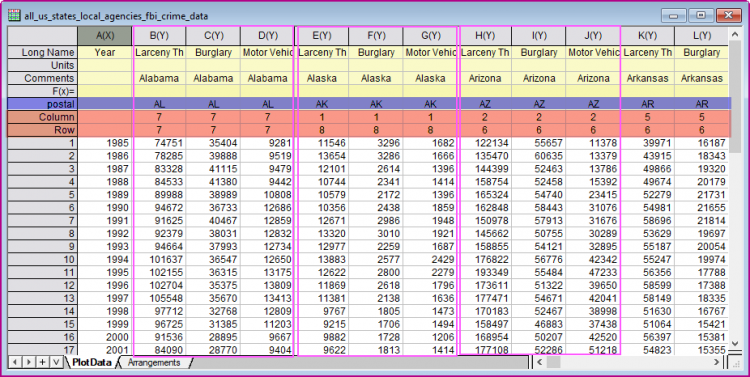
- Activate the workbook. In the sheet "PlotData", the plot data of all states are arranged side by side for plotting the tiles; two column label rows ("Column" and "Row") store the column-row gridding data for arranging the tiles; one column row "postal" stores the indentifiers of the states.
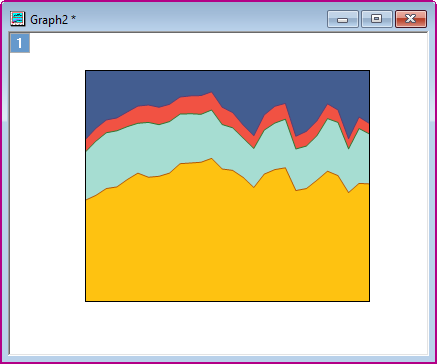
Prepare a Base Graph
- Highlight col(B)~col(D) to select Plot > Bar, Pie, Area : Stacked Area menu to plot a stacked area graph.
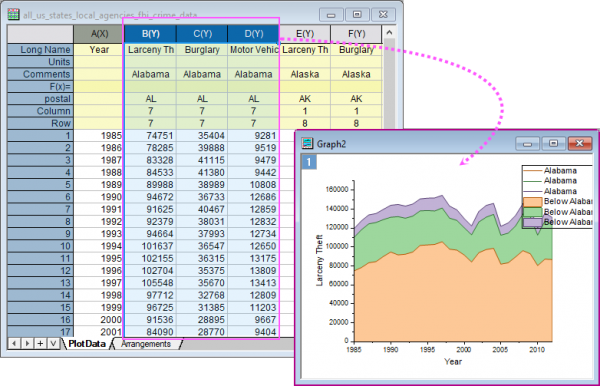
- Remove the legend box, hide ticks and tick labels for X and Y axis, show the layer frame, fill the layer background with a desired color and change the fill area color with a pre-defined color list.
- The base graph is ready.
Create a Tile Grid Map from the Base Graph
- Activate the source workbook. Highlight all columns in the sheet "PlotData" to select Plot > Map : Tile Grid Map to open the plottilemap dialog.
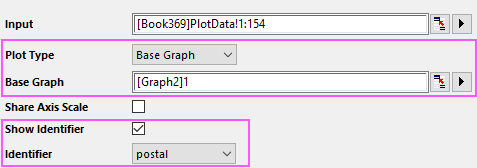
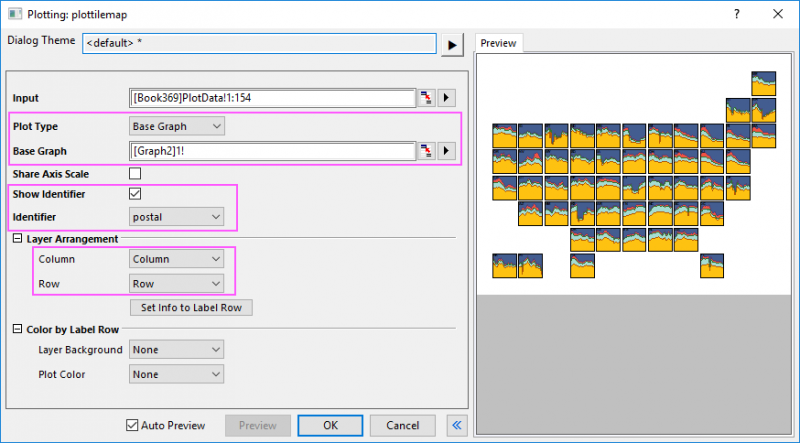 - In this dialog,
- Choose Base Graph as Plot Type. And then click the Select a Graph button
 at the end of the Base Graph box to choose the base graph we just created. at the end of the Base Graph box to choose the base graph we just created.
- Check the box Show Identifier and then select postal as Identifier.
- Select label row "Column" and "Row" for Column and Row dropdown list respectively.
- Click OK button to create the tile grid map. In tile grid map, when you customize one tile, all tiles will be updated together. Move one label and change its font size.
How to Obtain the Arrangement Data
In the sample project, the gridding data has been arranged well in the column label rows. You can easily select them in the plottilemap dialog. If you don't have such column label rows, besides entering these values into the cells manually one by one, you can use the method below to get them.
- Firstly, you need prepare such a table to illustrate how the tiles arranged by column-row gridding.
 - You can manually create a table and use the column-row gridding index to location the tiles.
- For current sample graph, we have already provided an online template to let you download and get the arrangement table.
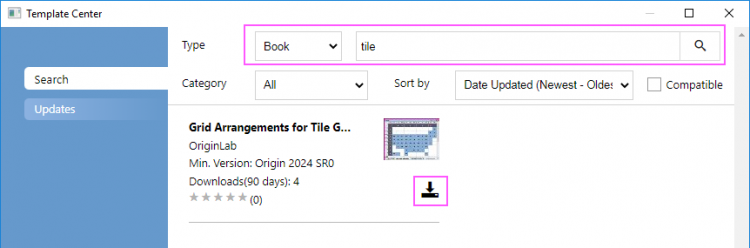
- Select Plot > Template Center menu to open Template Center. In this dailog, select "Book" for Type and search keyword "tile" to find the template "Grid Arrangements for Tile Grid Map". Click the Download and Install button to get the template.
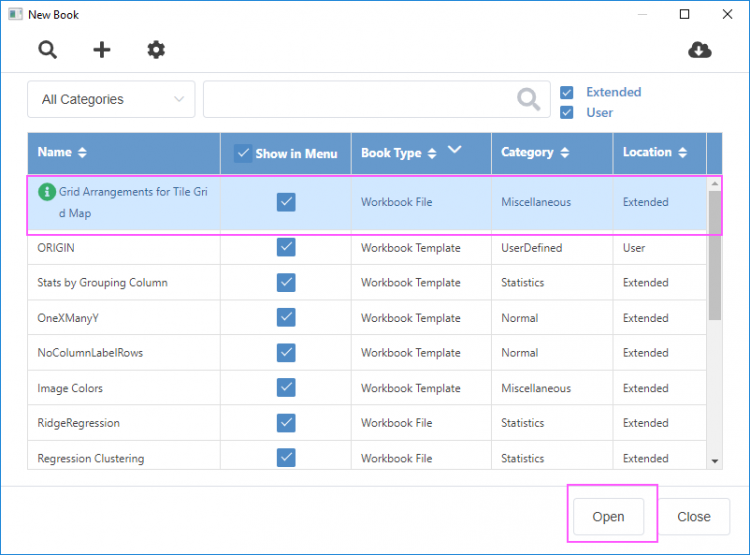
- Close Template Center and then select menu File: New: Workbook: Browse to open the New Book dilaog. Select the template "Grid Arrangements for Tile Grid Map" and click Open button to open it.
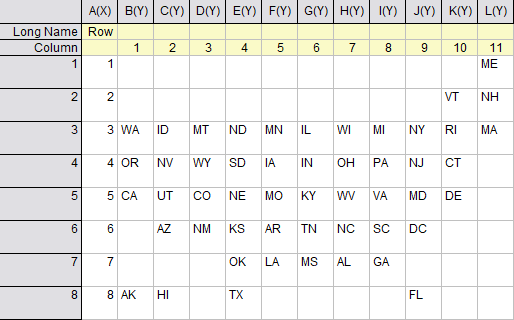
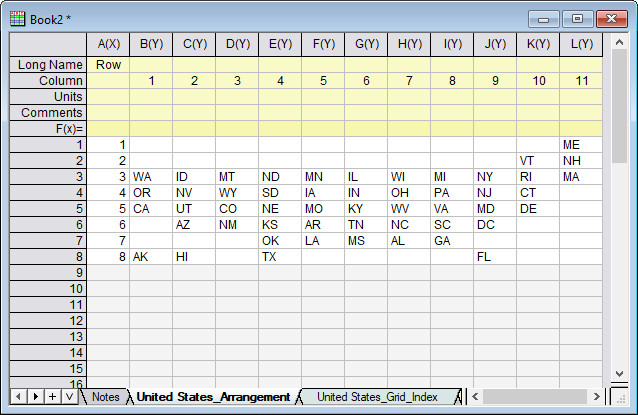
- Close New Book dialog. Go to the sheet "United States_Arrangement", you will see the grid arrangement data for US States.
 - You can reset the position of state codes to change the tile arrangement if needed.
- We are going to obtain the grid coordinates for all states. Highlight column B~L in the sheet, select Restructure: Stack Columns menu to open the Stack Columns dialog.
- Select the label row "Column" as Group Row(s); Check Include Other Column(s) check box and select col(A) for it; Check Exclude Missing Rows check box; Enter "StateCode" in Data Column Long Name box.
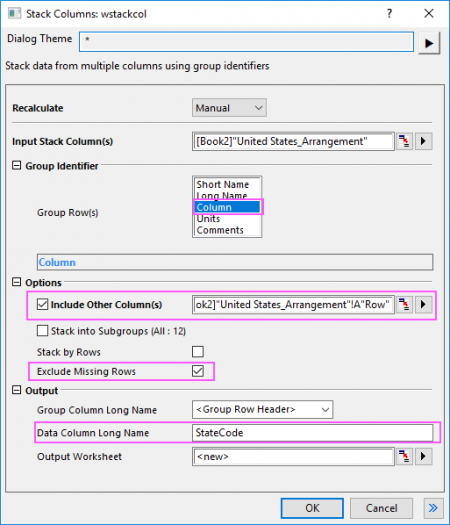
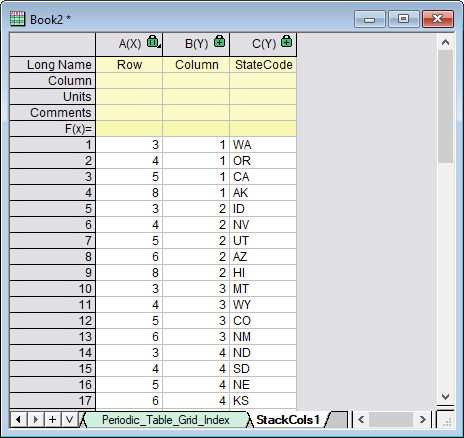
- Click OK button. A new sheet will be created, same as the existing worksheet "United States_Grid_Index".
How to use the Arrangement Column Data when Plot Tile Grid Map
Once you got these three columns above, you can use them to plot the tiles at the specified positions.
- Copy this sheet to the source workbook "all_us_states_local_agencies_fbi_crime_data".
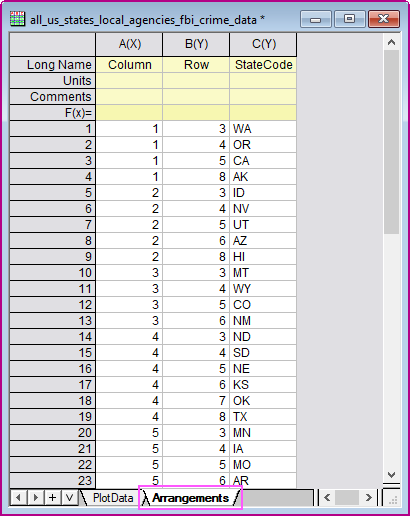 - Note:A sheet "Arrangements" has already been created with the arrangement column data in the sample project.
- With the base graph has been prepared in advance, highlight all columns in sheet "PlotData" to select Plot > Map : Tile Grid Map to open the plottilemap dialog. Select Base Graph as Plot Type and select the base graph you prepared; check Show Identifier check box and select "postal" for Identifier.
- Click Set Info to Label Row button to select the arrangement column data to convert them to column label rows and insert them into the source sheet "PlotData".
 - As you can see the arrangement data has been coverted and inserted into source sheet with the plot data. And they will be selected automatically in the Layer Arrangement group of the plottilemap dialog.
|