6.6.5 Grouped Column with Error Bars and Data LabelsGroupedColumn-ErrBar-Label
Summary
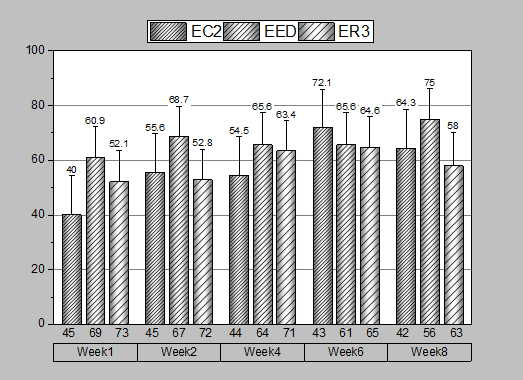
Origin supports grouped column graphs with indexed data. Multiple group levels are supported. Grouping information can be shown in tick label tables on the X or Y axes.
What will you learn
This tutorial will show you how to
- Plot grouped column and error bar with indexed data
- Customize tick labels, colors, gaps, error bars and data labels
- Update legend to show grouping information.
Steps
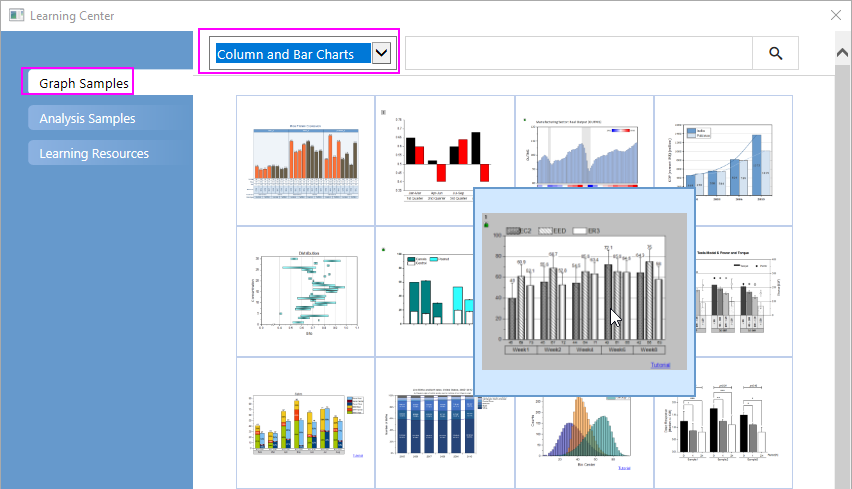
- Select Help: Learning Center menu or press F11 key to open the Learning Center, and then select Graph Sample in left panel and select the category "Column and Bar Charts", find this graph and double-click on it to open this sample.
- We are going to create a grouped column chart from the worksheet "Weekly Data". Highlight column D(Y2) and E(yErr) and select Plot > Categorical : Grouped Columns - Indexed Data... from the main menu.
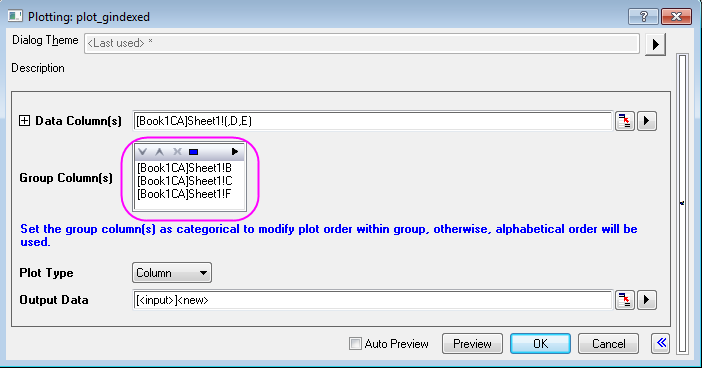
- In plot_gindexed dialog, click
 in the "Group Column(s)" to add columns B, C, and F (in that order) to the Group List. Click the OK button. in the "Group Column(s)" to add columns B, C, and F (in that order) to the Group List. Click the OK button.
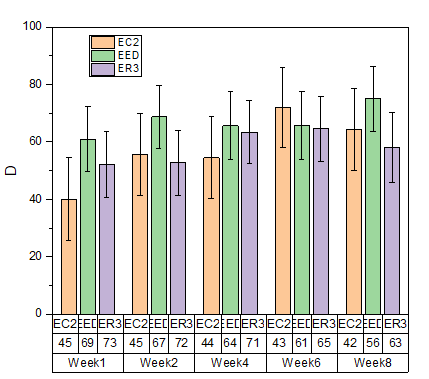
A grouped column plot with error bar is created. The 3-row tick label table at the bottom shows the grouping information. Note that a worksheet is created to contain the data used to create this graph.
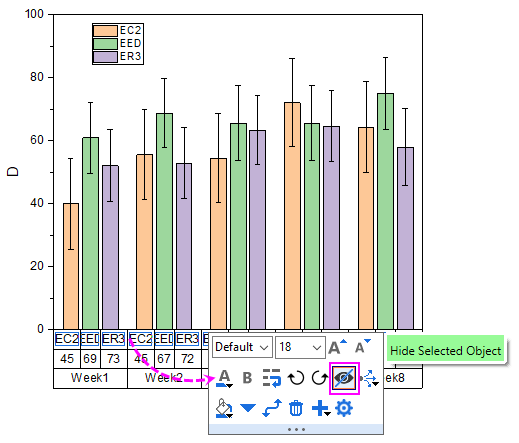
- To hide the first tick label row, click on the tick label in the 1st row, and in the popup minitoolbar, click the Hide Selected Object button to hide this table row.
- Double-click on another bottom table row to open the Axis dialog. Go to the Tick Labels tab, select the Bottom 2 icon on the left panel. On the Table sub-tab, clear the Auto box, clear all Border check boxes then click the OK button.
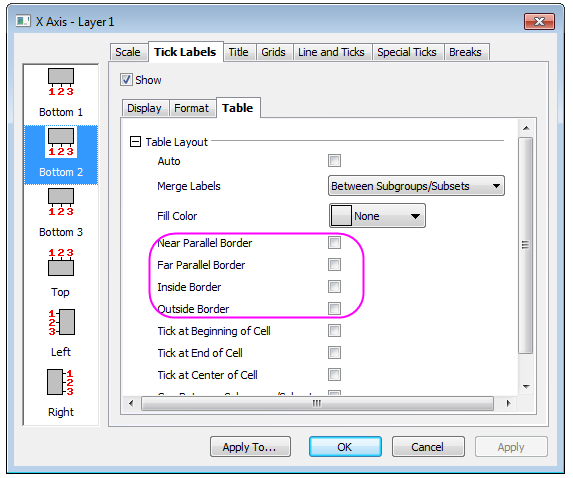
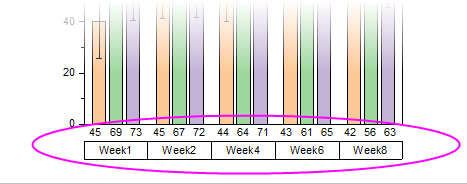
Two tick label rows remain, each with different layout.
Further Customizations
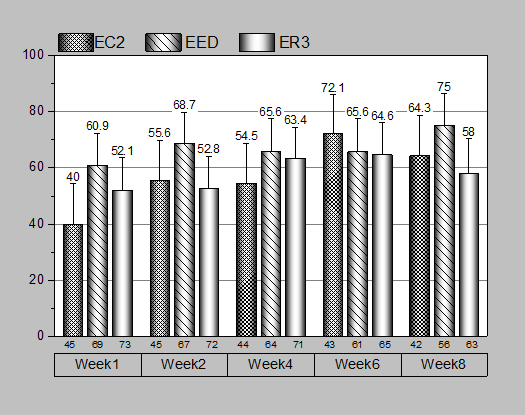
The tutorial steps that follow, further customize the graph so that it looks like the image in the Summary section.
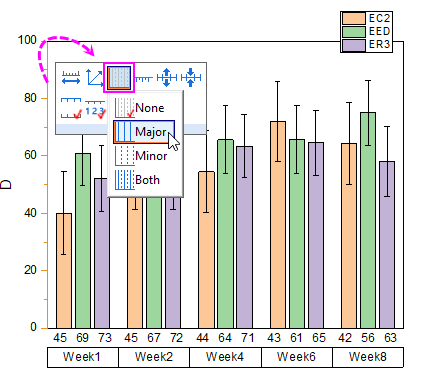
- Click on the left Y axis in the graph, and in the popup mini toolbar, click the Show Gridlines button
 to select Major from the drop-down list to add major grad lines for the graph. to select Major from the drop-down list to add major grad lines for the graph.
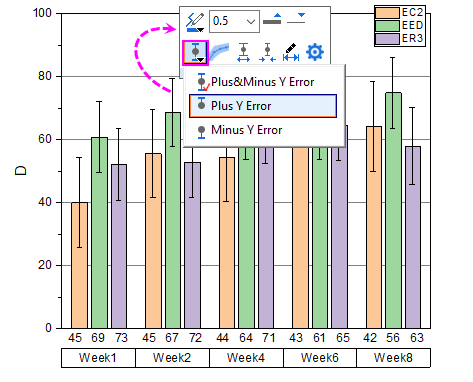
- Click on any error bar in the graph, and in the popup mini toolbar, click the Direction button
 to select Plus Y Error from the list to just show the plus Y errors. to select Plus Y Error from the list to just show the plus Y errors.
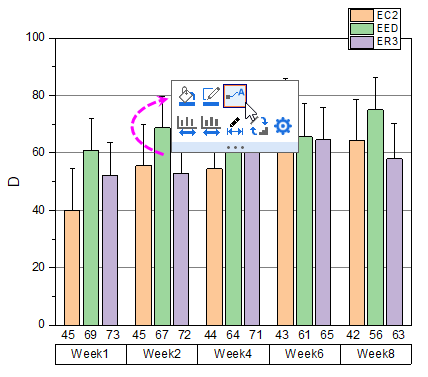
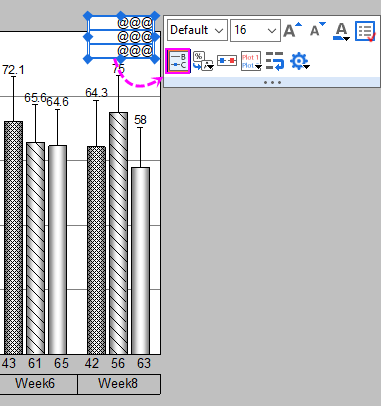
- Click on any column in the graph, and in the popup mini toolbar, click the Show Data Labels button
 to show the labels at the top of the error bars. to show the labels at the top of the error bars.
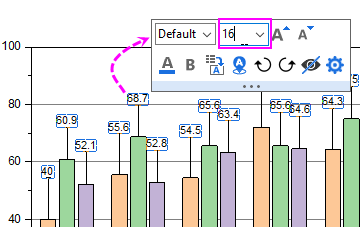
Click on any label, and in the popup mini toolbar, set Font Size to "16".
 | To format the label values, you can double-click on the labels to open the Labels tab of Plot Details dialog to set the Numeric Display Format drop-down list.
For instance, to show a single decimal place for each label, enter ".1", then click OK. For more information, see Custom Numeric Formats
|
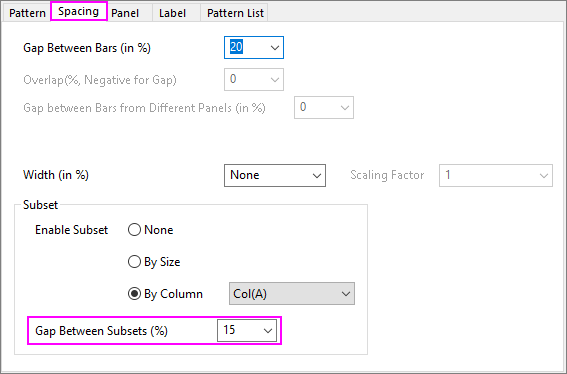
- Double-click on the columns to open the Plot Details dialog. To adjust the gap between each week, go to the Spacing tab and set the Gap Between Subsets(%) to 15 (hint: you can type into the box).
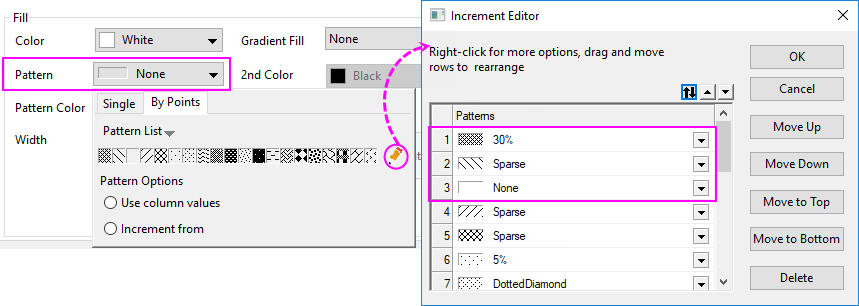
- We are going to use the data in column C to set fill pattern and add a color gradient fill to the column plot. Go to the Pattern tab of Plot Details and set as follows.
To set fill Color to White, click the drop-down, click the Single tab and click the White cell. Similarly, for fill Pattern, click the drop-down, click the By Points tab, and then click the pencil icon to the right of the pattern list. This opens the Increment Editor, where you create your custom pattern list. Rearrange the top three entries in your custom list as shown, by dragging the numbered buttons to the left side of the pattern gallery.
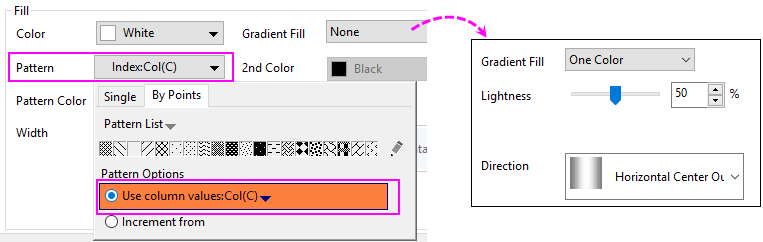
- Click OK button to close the editor. Click the Use Column Values button and choose Col(C) from the list. The Gradient Fill should be One Color and the direction should be Horizontal Center Out.
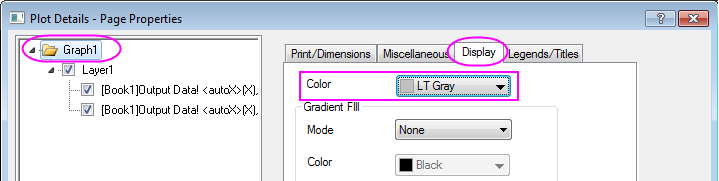
- To change the graph page background color, select the Graph icon in the left panel of the Plot Details dialog box. Go to the Display tab and set color to LT Gray.
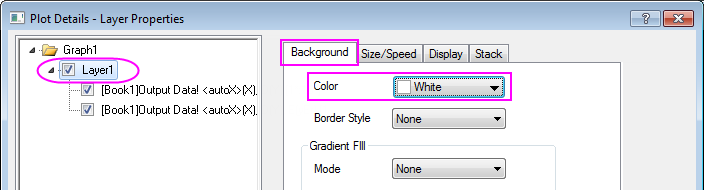
- To change layer background color to white, select Layer1 node on left panel of the Plot Details dialog. Go to the Background tab and set Color to White. Click OK to close Plot Details.
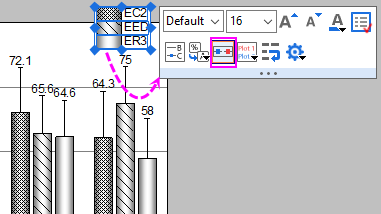
- To show pattern information in the legend, click the legend, and in the popup mini toolbar, click the Reconstruct Legend button to show all categories.
To arrange the legend horizontally, select the legend, and in the popup mini toolbar, click the Arrange in Horizontal button to show these legend entries horizontally.
- Drag the legend to an appropriate position. Select and press Delete to remove the Y axis title.
| To center and adjust margins on a finished graph, click on the graph to activate it, then choose Graph: Fit Layers to Page. Enter your Margin and determine whether to Maintain Layer Aspect Ratios, then click OK.
|
|