2.3 Plotting with a User-Defined TemplateIn this tutorial, we will show you how to plot with a user-defined graph template in Labview. Make sure there is a graph template named MyGraphTemplate under path "C:\". (Hint: you can use the the graph template in Tutorial: Customizing Graphs: Customizing a Graph)
1. Run Origin. Make sure that there is a Workbook with the default "Book1" and "Sheet1". Fill the first two column with row numbers by selecting the two columns and right click, choose Row Numbers from Fill Columns With.
2. Select File: Import: Single ASCII from the menu, then find Linear Fit.dat from <Origin installation folder>\Samples\Curve Fitting\ and make sure the Show Options Dilalog checkbox has been selected. Select Start New Column for Import Options: Import Mode. Unwrap the (Re)Naming Worksheet and Workbook branch, disable the Rename Sheet with(Partial) Filename and the Rename Book with(Partial) Filename checkboxes. Then click OK button to import the file.
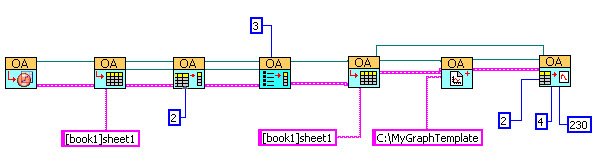
3. Run Labview, create a new VI and active the Block Diagram window. Then choose OA_ConnectToOrigin VI  and place it to the window. and place it to the window.
4. Select and place OA_FindWorksheet VI  , then wire the Origin.IOApplication and Error IO connectors to the corresponding connectors of the OA_ConnectToOrigin VI. , then wire the Origin.IOApplication and Error IO connectors to the corresponding connectors of the OA_ConnectToOrigin VI.
5. Add a string constant and assign to it the string [Book1]Sheet1. Wire the string constant to the Name connector of OA_FindWorksheet VI.
6. Select and place OA_GetColumn VI  , then wire the Origin.Worksheet and Error IO connectors to the corresponding connectors of the OA_FindWorksheet VI. , then wire the Origin.Worksheet and Error IO connectors to the corresponding connectors of the OA_FindWorksheet VI.
7. Add a numeric constant and set it to 2, and wire it to the Column Name/Index connector of OA_GetColumn VI.
8. Select and place OA_Col-Setting VI  , then wire the Origin.Column and Error IO connectors to the corresponding connectors of the OA_GetColumn VI. , then wire the Origin.Column and Error IO connectors to the corresponding connectors of the OA_GetColumn VI.
9. Add a numeric constant and set it to 3, and wire it to the Type connector of OA_Col-Setting VI to set the type of column 2 to X, since Only XY type of plots are supported with OA_PlotWksCols VI.
10. Select and place OA_FindWorksheet VI again, then wire the Origin.IOApplication connector to the corresponding connectors of the firstOA_FindWorksheet VI, and wire the Error IO connector to the corresponding connectors of the OA_Col-Setting VI.
11. Add a string constant and assign to it the string [Book1]Sheet1. Wire the string constant to the Name connector of the second OA_FindWorksheet VI.
12. Select and place OA_NewEmptyGraph VI  , then wire the Origin.IOApplication and the Error IO to the corresponding connector of the second OA_FindWorksheet VI. , then wire the Origin.IOApplication and the Error IO to the corresponding connector of the second OA_FindWorksheet VI.
13. Add a string constant and assign to it the string C:\MyGraphTemplate. Wire the string constant to the Template Name connector of the second OA_NewEmptyGraph VI.
14. Select and place OA_PlotWksCols VI  , then wire the Origin.Worksheet in connector to the corresponding connector of the Second OA_FindWorksheet VI. Wire the Origin.GraphLayer in and Error IO connectors to the corresponding connector of OA_NewEmptyGraph VI. Then create three numeric constant and set them to 2, 4, 230. Connect 2, 4, 230 to c1, c2, plotType connectors separately. , then wire the Origin.Worksheet in connector to the corresponding connector of the Second OA_FindWorksheet VI. Wire the Origin.GraphLayer in and Error IO connectors to the corresponding connector of OA_NewEmptyGraph VI. Then create three numeric constant and set them to 2, 4, 230. Connect 2, 4, 230 to c1, c2, plotType connectors separately.
15. When all of these are finished, the Block Diagram should look like:
16. Click Run button to run this VI and then you can turn to Origin to see the result.
|