2.6.3.1 img2xyz(Pro)
Menu Information
Image: Arithmetic Transform: Extract to XYZ
Brief Information
Extract to XYZ Data
Additional Information
It is not accessible from script. This feature is for OriginPro only.
This feature is updated in 8.0 SR4. For more details, please refer to Release Notes.
X-Function Execution Options
Please refer to the page for additional option switches when accessing the x-function from script
Variables
|
Input Image
|
Specifies the input image to be manipulated. The default input is the active image
|
|
Anchor Shape
|
Specifies the shape (either rectangle or ellipse) of the area to be extracted.
|
|
XYZ Data
|
Specifies the output XYZ range on the worksheet
|
|
ROI Data
|
If this checkbox checked, the intensity data within the selected area will be output to a specified matrix. Otherwise, the preview will not be outputted.
Note that if Ellipse is selected as Anchor Shape, the intensity data inside the external-tangent rectangle of the ellipse area will be output into the matrix as well.
|
Description
This function extracts the intensity data and the corresponding X, Y coordinate data of selected area on the image, into an XYZ data of the worksheet.
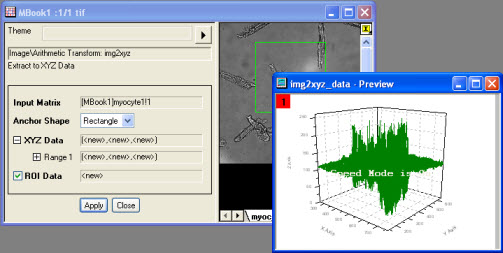
This function is opened in the X-Function panel. User can select the area to be extracted by moving and resizing the anchor object on the image, and then the intensity data in the selected area will be plotted in the 3D graph named img2xyz_data.
Note that if the input image is 24-bit or 48-bit color image, the image will be auto converted into an 8-bit or 16-bit grayscale image before extracting.
Examples
The following example shows how to use this X-Function to extract data within a selected rectangle on the image:
1. Create a matrix and import myocyte1.tif under \Samples\Image Processing and Analysis folder into it.
2. From the menu, select Image: Arithmetic Transform: Extract to XYZ... to open this function in the X-Function panel beside the input image.
3. Move and resize the rectangle object on the image, and then the intensity data plot of the selected area will be shown in the graph named img2xyz_data, as shown as below:
4. Click the OK button, the XYZ data will be saved in the output worksheet.
|