6.11.7 Polar Graph with Custom Angular Scalepolar-custom-angular
Summary
Normally, the polar angular axis unit reads in degrees, radians or gradians. However, Origin's polar graph also supports use of custom units.
Minimum Origin Version Required: 2018b
What You Will Learn
This tutorial will show you how to:
- use a dataset to control symbol size and color in a polar graph.
- use a custom unit for the angular axes.
- display tick labels as quarters.
- add and custom the bubble scale
Steps
You can refer to this graph in Learning Center. (Select Help: Learning Center menu or press F11 key , and then open Graph Sample: Polar Graphs)
- Highlight column B and select Plot > Specialized :Symbol theta r to create a symbol plot in polar coordinate system.
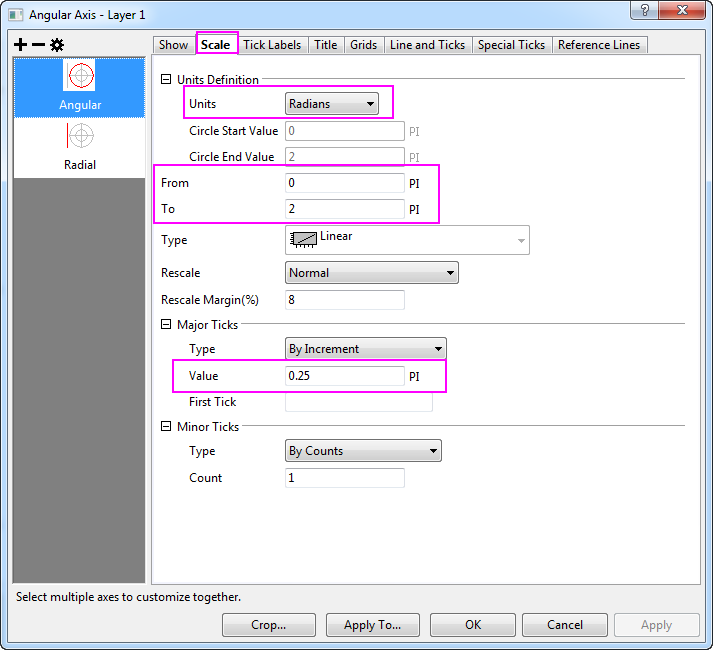
- Double-click on any axis to open the Axis dialog. Go to the Scale tab and select Angular in the left panel. In this right panel, expand Units Definition node, and choose Radians as Units. Make sure the scale from 0 to 2 PI. Then change the Value of increment to 0.25
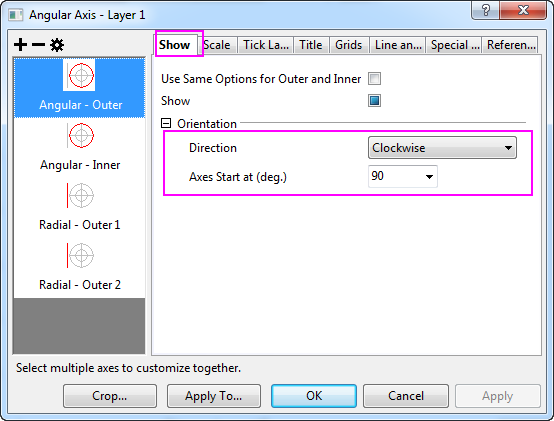
- Go to the Show tab for Angular-Outer axis, then change the Direction to Clockwise and set Rotate (deg.) to 90.
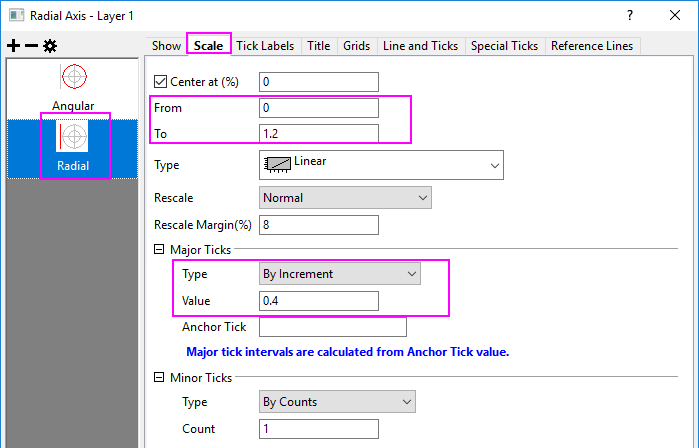
- Go to the Scale tab and select 'Radial in the left panel. Then set the scale from 0 to 1.2, and change the Value of increment to 0.4.
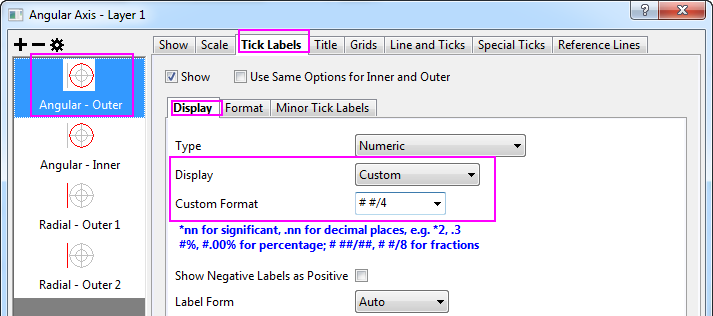
- Go to Tick Lables tab for the Angular- Outer axis. Open Display subtab, set Display to Custom and enter
# #/4 as Custom Format to show the tick labels as fractions.
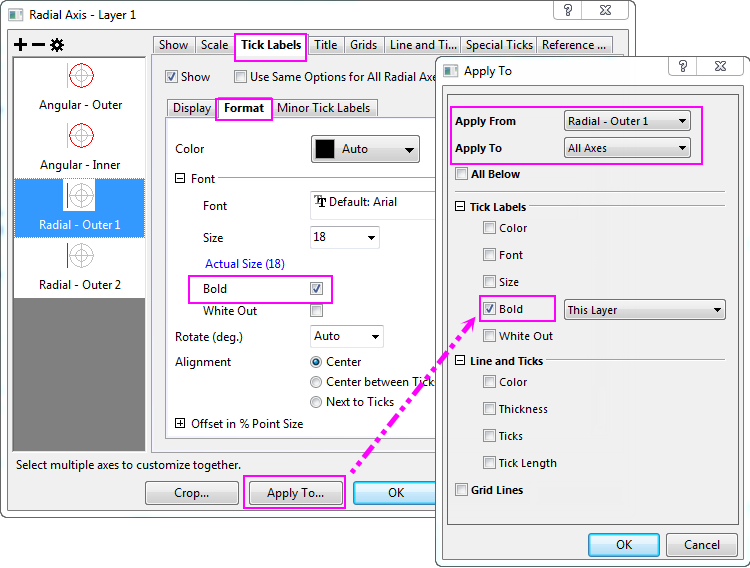
- Select Radial- Outer 1 axis. Choose Format subpage, and check the Bold check box. Then click the Apply To... button. In the pop-up dialog, make sure Apply From is Outer 1 and Apply to is All Axes, then check the Bold under the Tick Labels. Click OK.
In Axis dialog, click OK to apply settings and close the Axis dialog.
- Double-click on the line plot to open the Plot Details dialog, in the Symbol tab, recreate the following settings, in the sequence shown in the screenshot:
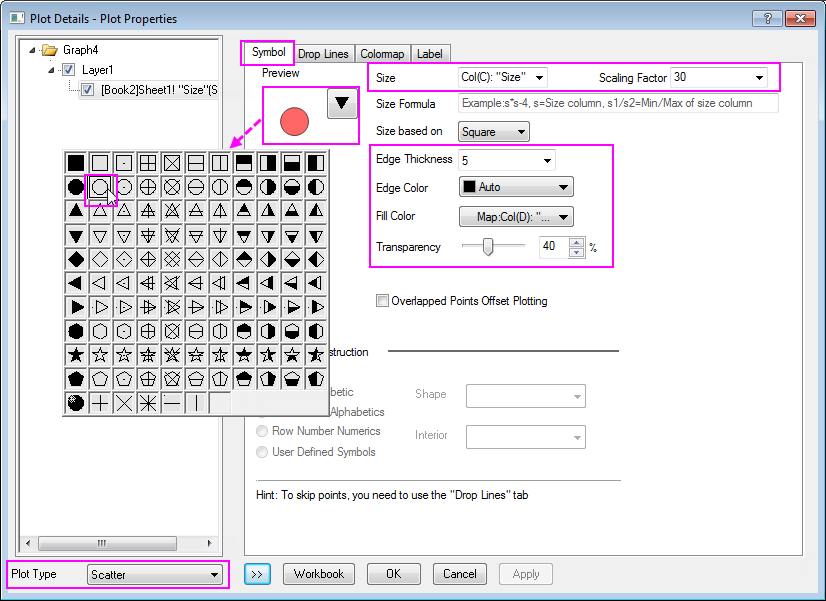
Click OK to apply the settings and close the Plot Details dialog.
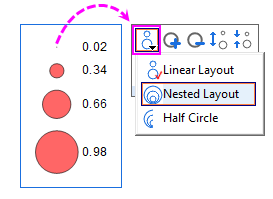
- Select Bubble Scale in the Insert main menu to add a bubble scale in this graph. Click the bubble scale, and in the popup mini toolbar, click Layout button to select Nested Layout form the drop-down list.
- Click the scale again, and in the popup mini toolbar, click the Bubble Style button to remove the fill color for the bubbles.
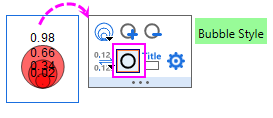
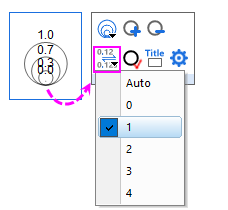
- Click the scale again, and in the popup mini toolbar, click Decimal Places to set it to be 1.
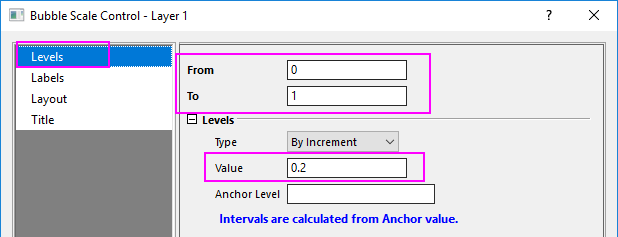
- Double-click on the bubble scale to open the Bubble Scale Control dialog. Go to the Levels page, set the level from 0 to 1, and change the Value of increment to 0.2.
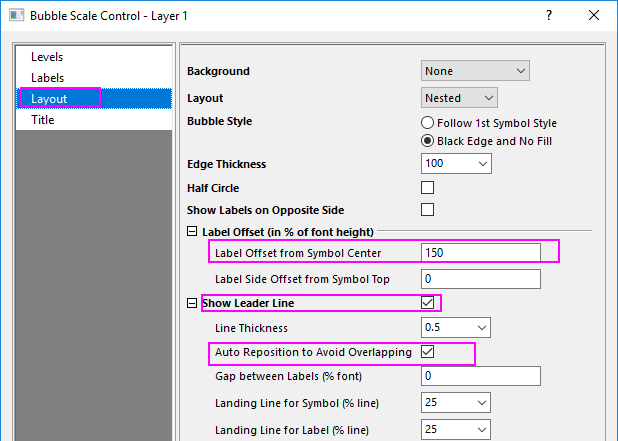
- Go to Layout page, change the Label Offset from Symbol Center to 150. Check the Show Leader Line check box, then expand the node to check the Auto Reoisition to Avoid Overlapping check box. Click OK to apply the setting and close the dialog.
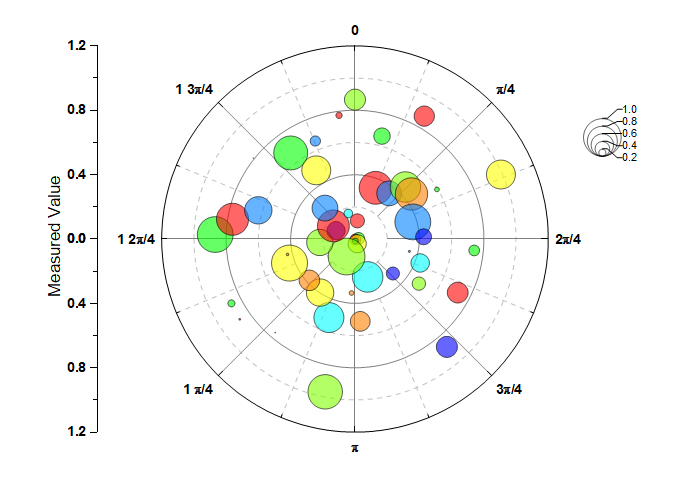
Manually move the legend object and Radial axis, and click the Enable\Disable Anti-Aliasing button  to smooth the graph. The final graph should look like this: to smooth the graph. The final graph should look like this:
|