6.3.2 Multiple Layers with Linked AxisMultiLayer-LinkAxes
Summary
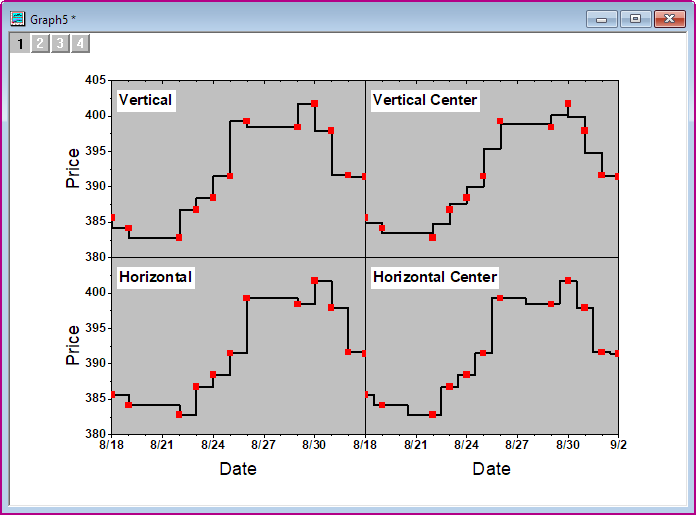
This tutorial will show how to merge four graphs to one graph, which contains multiple layers with linked axis.
What you will learn
- How to make a Line + Symbol plot
- How to merge graphs
- How to link axis of layers
- How to customize axis
Steps
This tutorial is associated with the Tutorial Data project:<Origin EXE Folder>\Samples\Tutorial Data.opj.
- Open the Tutorial Data project and browse to folder Multiple Layers with Step Plot in Project Explorer.
- Activate the workbook and highlight column Value1 and make a graph by selecting Origin menu Plot > Basic 2D : Line + Symbol.
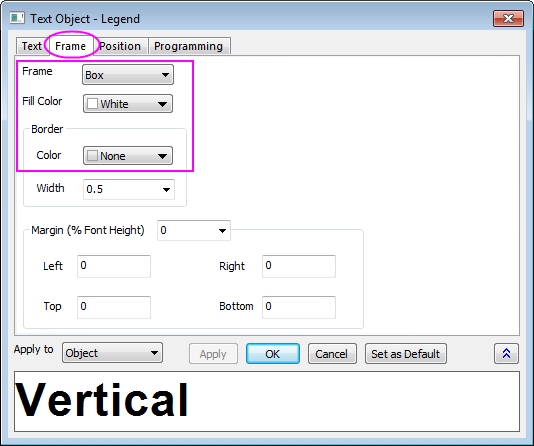
- Activate the graph, right-click the legend and choose Properties from the context menu. In the Object Properties dialog,
- In the Text tab, put this text in the text field: \b(Vertical) and set Size to 36.
- Go to the Frame tab, and set as following image. Click the OK button. Move the legend to the correct position.
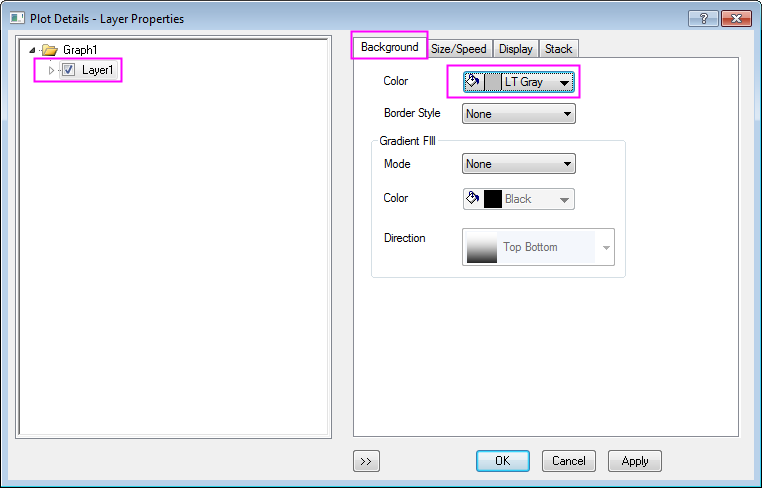
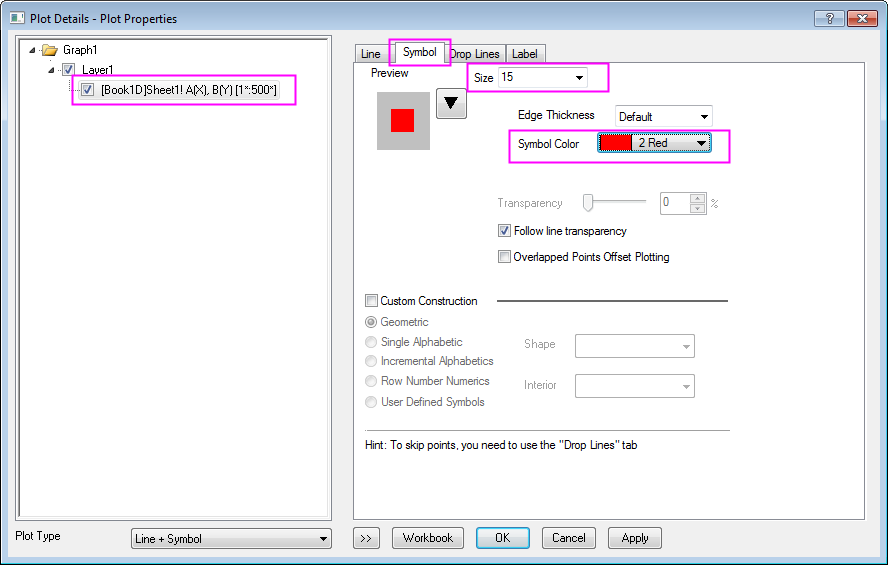
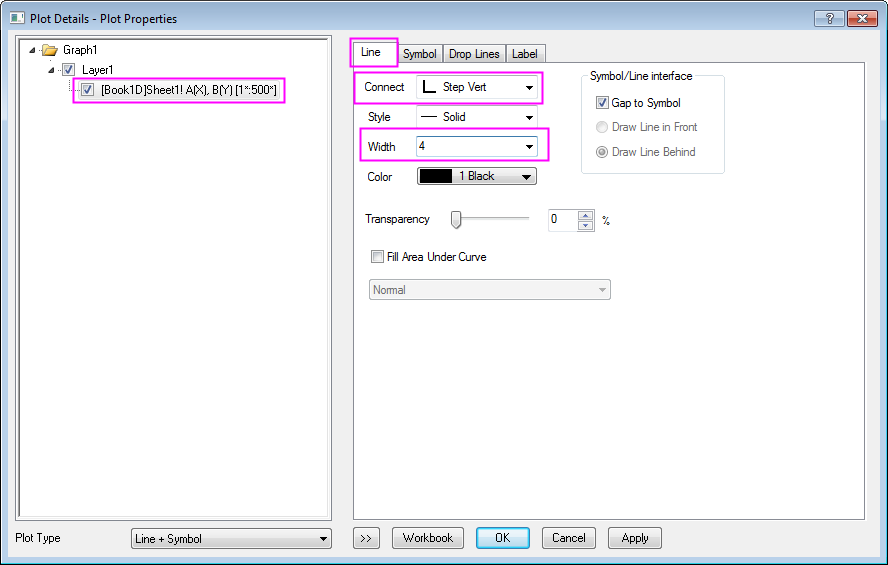
- Double click on the open white space in layer of the graph to open the Plot Details dialog. In the left panel, select Layer1. Activate the Background tab in the right panel, choose LT Gray for the Color. Then select the plot in Layer1 from the left panel, under the Symbol tab in the right panel, set Size to 15 and Symbol Color to red. Switch to the Line tab, choose Step Vert from the Connect drop-down list and set Width to 4 and click OK to apply settings.
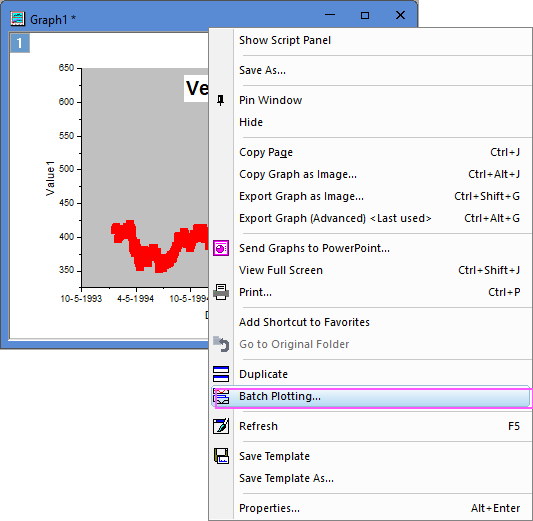
- Now we are going to duplicate similar graphs from the other three columns. Right click on the graph window title bar and select Duplicate (Batch Plotting) from the context menu:
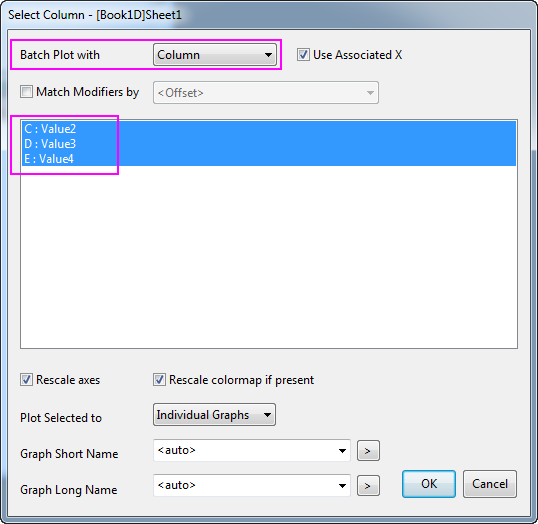
- In the dialog that opens, select Column from the Batch Plot with drop-down list, hold Ctrl key and click to select all three columns C, D, E and click OK:
- For graph from each column, the legend text and Connect drop-down list will be different, listed below.
- For column Value2: legend text = \b(Vertical Center); Connect = Step V Center
- For column Value3:legend text = \b(Horizontal); Connect = Step Horz
- For column Value4: legend text = \b(Horizontal Center); Connect = Step H Center
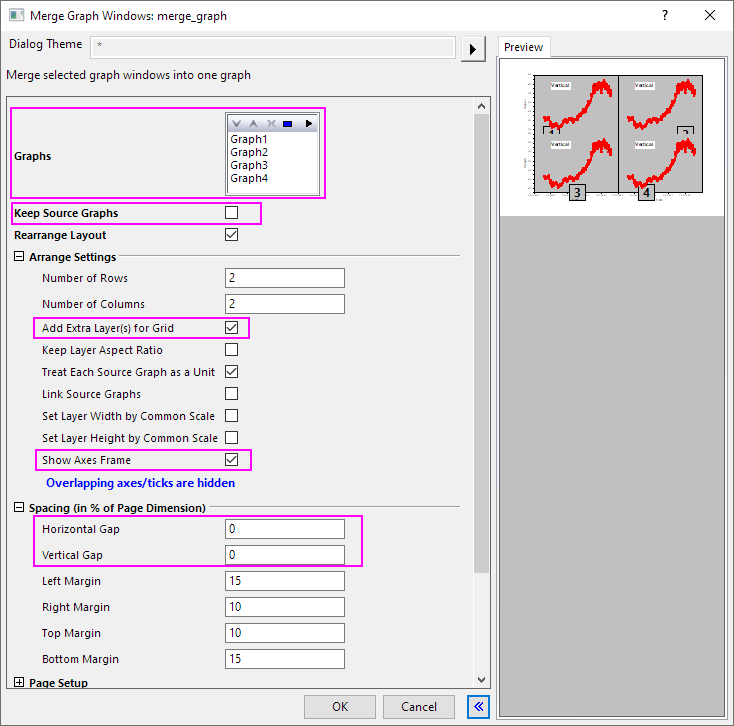
- Activate a graph and then select Origin menu Graph: Merge Graph Windows to open the merge_graph dialog. Change the settings as the following image shows. Then click the OK button to merge these graphs.
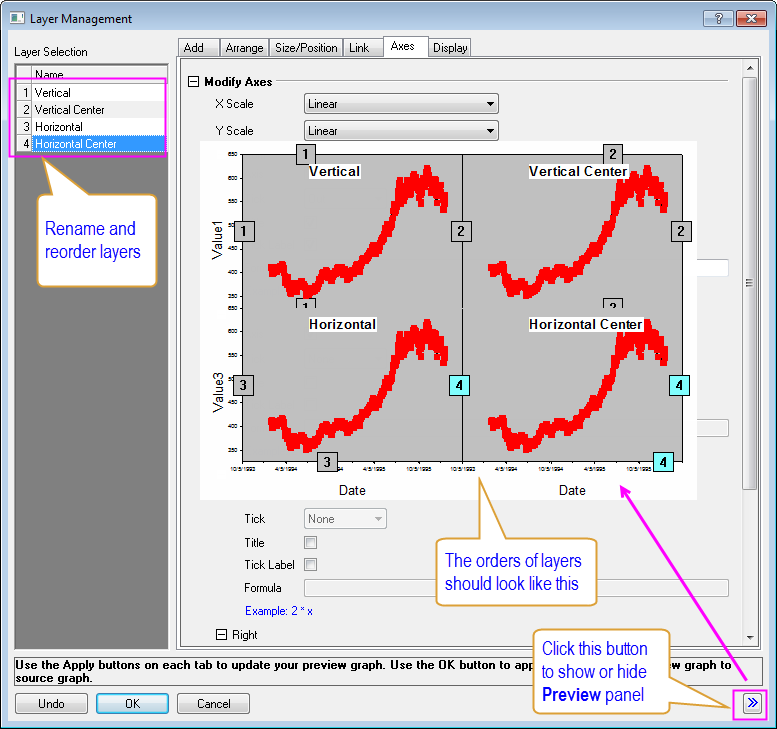
- Activate the new merged graph, choose Origin menu Graph: Layer Management to open the Layer Management dialog. In the Layer Selection panel, rename the layers by double clicking on the name and reorder the layers by clicking on the layer index and dragging up and down. Make sure the final layers' names and order are the same as the image shows below (In the Preview panel, the layers' indices and positions can be shown).
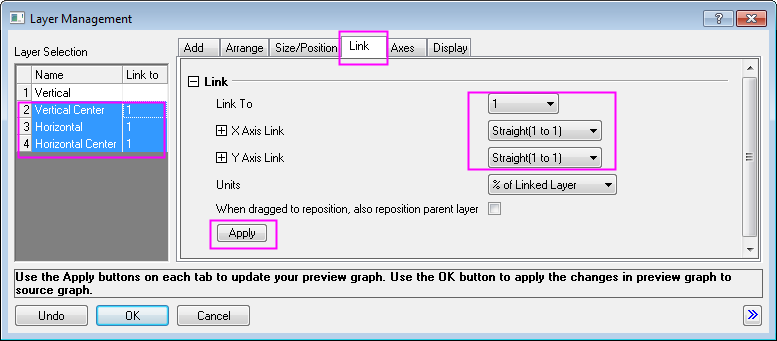
- In the Layer Selection panel, press Ctrl key on the keyboard to select the following layers: Vertical Center, Horizontal and Horizontal Center. Go to the Link tab, select 1 from the Link To drop-down list. Then both X Axis Link and Y Axis Link are set to Straight(1 to 1). Then click the Apply button.
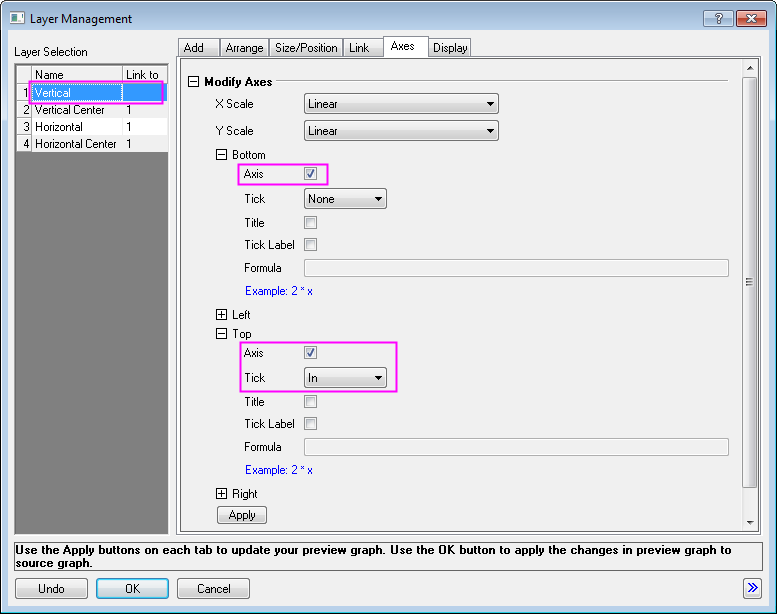
- Go to the Axes tab, select Vertical layer from the left panel, then check all Axis check-boxes under Bottom branch, Left branch, Top branch and Right branch. Also, select In for Tick drop-down list under Top branch. Click the Apply button.
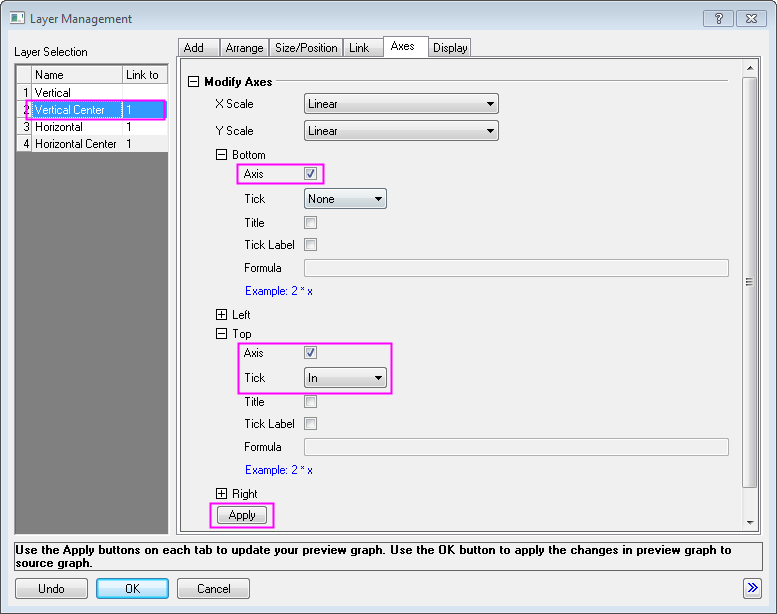
- Select Vertical Center layer, in the Axes tab, Bottom branch, Left branch and Right branch share the same settings. And settings for Top branch shows in the image below. Click the Apply button.
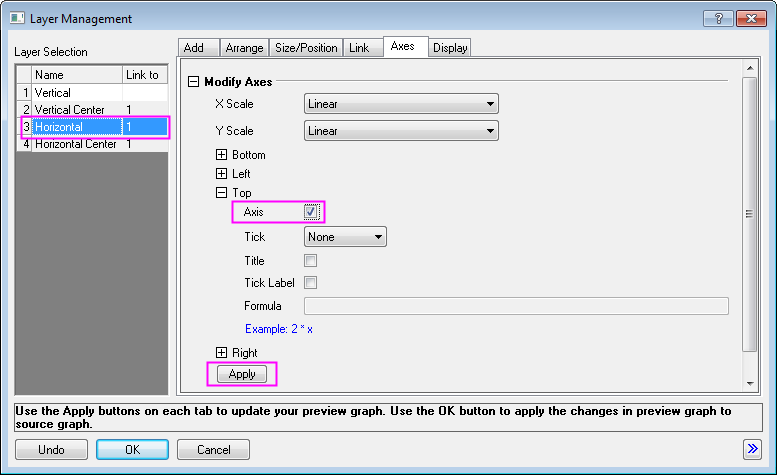
- Select Horizontal layer, in the Axes tab, check the Axis check-boxes under both Top branch and Right branch. Click the Apply button.
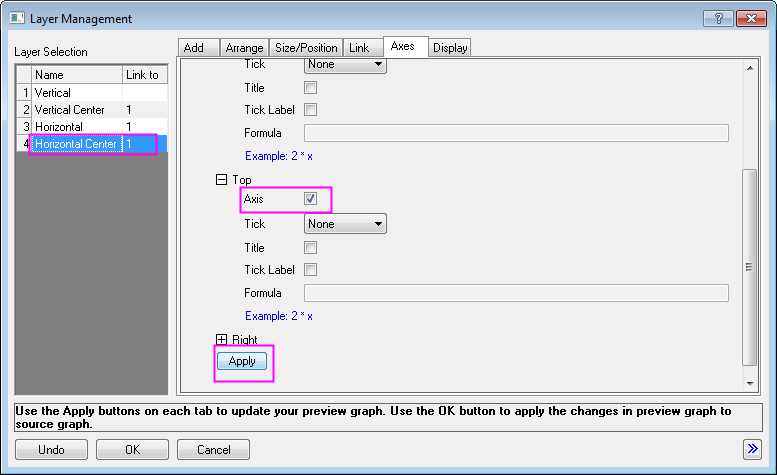
- Select Horizontal Center layer, in the Axes tab, check the Axis check-box under Top branch. Click the Apply button.
- Click the OK button to close the Layer Management dialog.
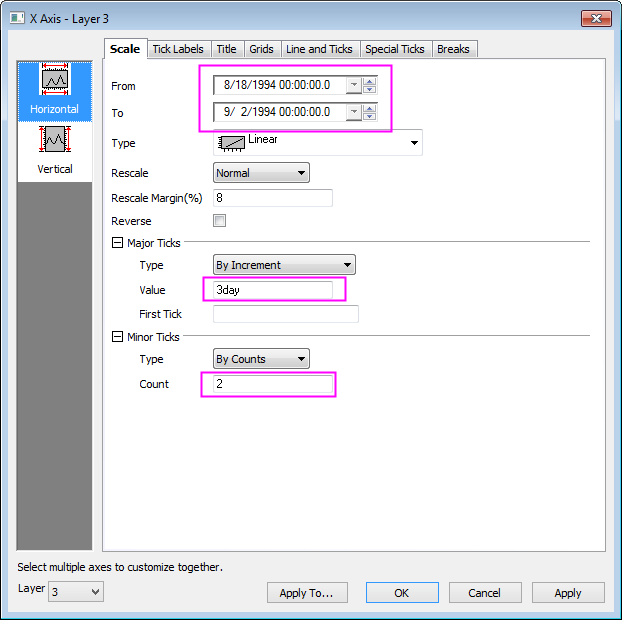
- Double click on the X axis of the lower-left layer to open the X Axis dialog. In the Scale tab, change the axis scale as the image below:
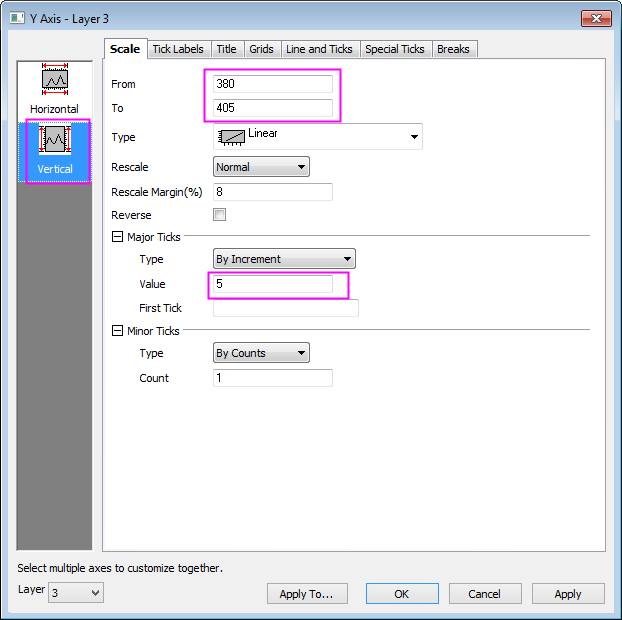
- Click the Vertical icon on the left panel to go to Scale tab for Y Axis and change the axis scale:
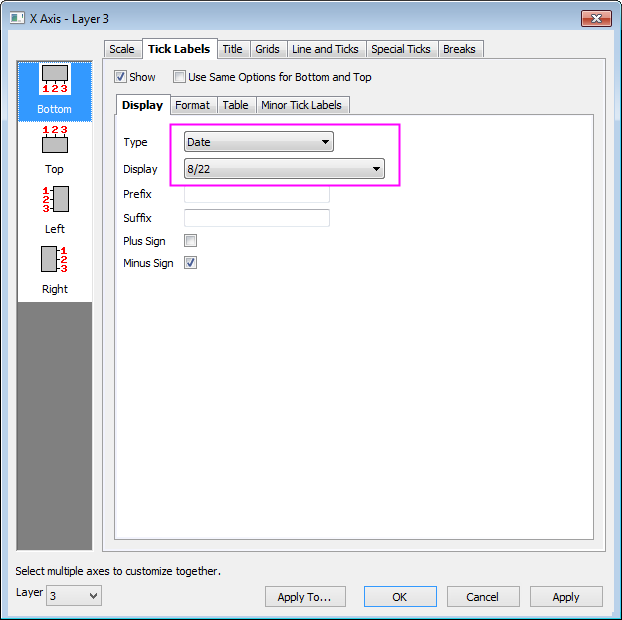
- Go to Tick Labels tab and click Bottom icon on the left panel and change the display of X tick labels:
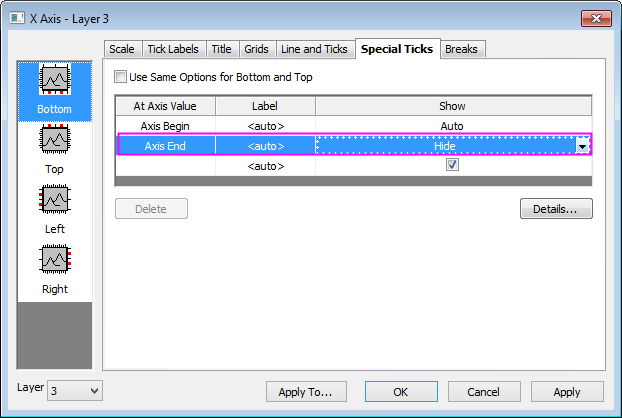
- Go to Special Ticks tab and hide the label at axis end by selecting Hide from Show drop-down list for Axis End:
- Click on the Left icon on left panel, and hide the label at Y axis end by selecting Hide from Show drop-down list for Axis End.
- Select Layer 4 in the left-bottom corner of the Axis dialog. And then repeat step 18.
- Go to Tick Labels tab and Format sub-tab, then set the Size to 16 and check Bold box.
- Click OK to save the setting and close the dialog.
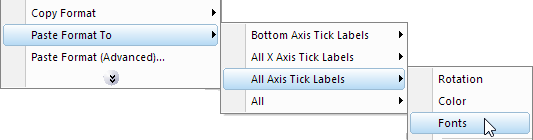
- Right-click on the X Axis Tick Label, and select Copy Format. Right-click on the black space of the graph, and select Paste Format to... : All Axis Tick Labels : Font
- Click on a Axis Title. In the Mini Toolbar, set font size to 18.
- Right-click on edited Axis Title, and select Copy Format: Styles. Right-click on the black space of the graph, and select Paste Format to... : All Axis Titles : Font
- Change the both Y titles to Price, and then make Titles to bold.
|