3.1 Tafel ExtrapolationTafel-Extrapolation
Summary
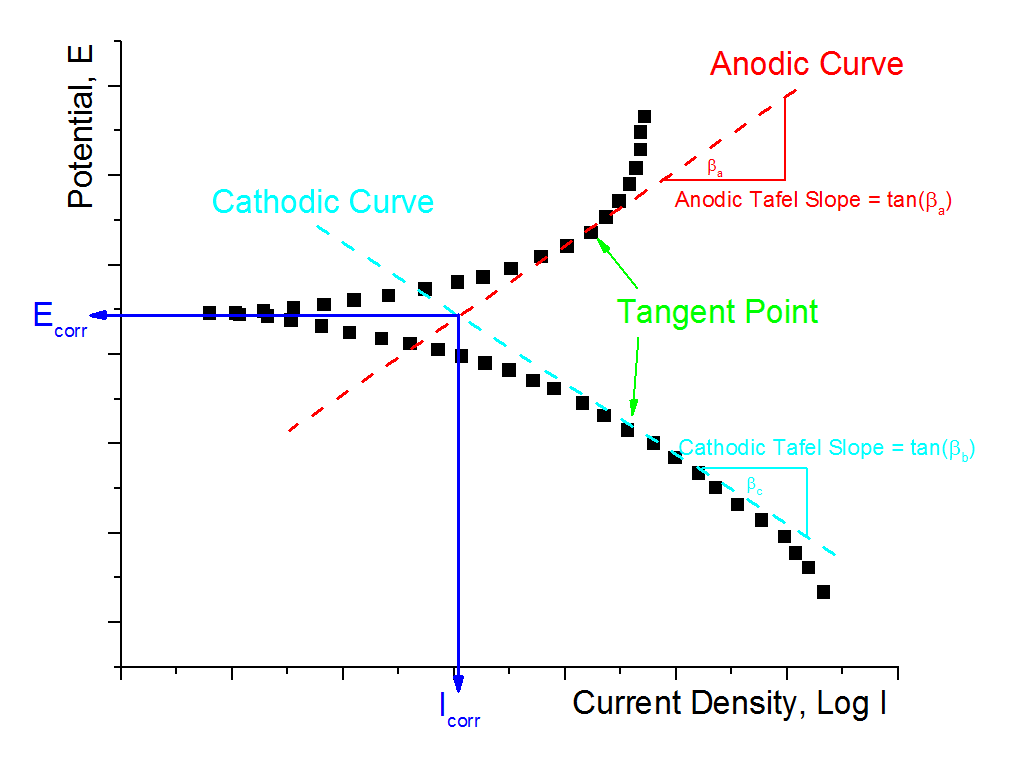
Tafel Extrapolation app is capable of calculating corrosion potential and corrosion current from a corrosion process curve which shows anodic and cathodic components of current.
Tutorial
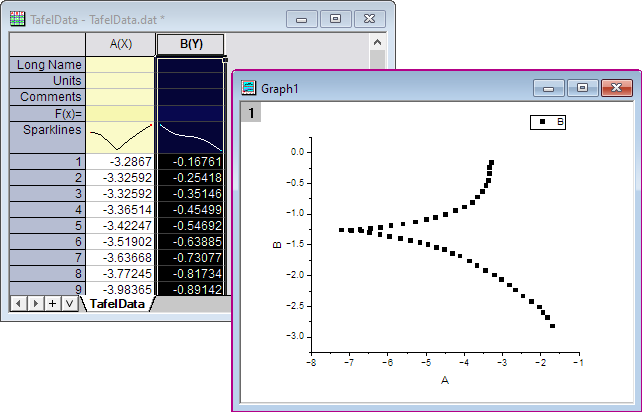
- Activate an empty worksheet, then run the following script in the Script Window to import the data for this example.
fname$ = "%@ATafel Extrapolation\TafelData.dat";
impasc;
- Select Y column, and then select Plot: Basic 2D: Scatter menu to make a Scatter plot.
- Make this newly created graph as the active window, then select the Tafel Extrapolation app icon
 from the Apps panel to bring up the dialog. from the Apps panel to bring up the dialog.
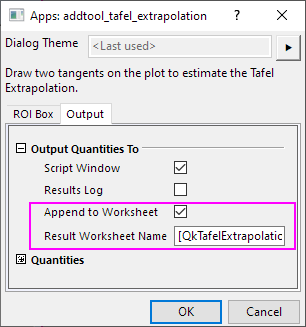
- Keep the default settings for ROI Box tab, and check Append to Worksheet checkbox in Output tab.
- Click OK button and go back to the graph.
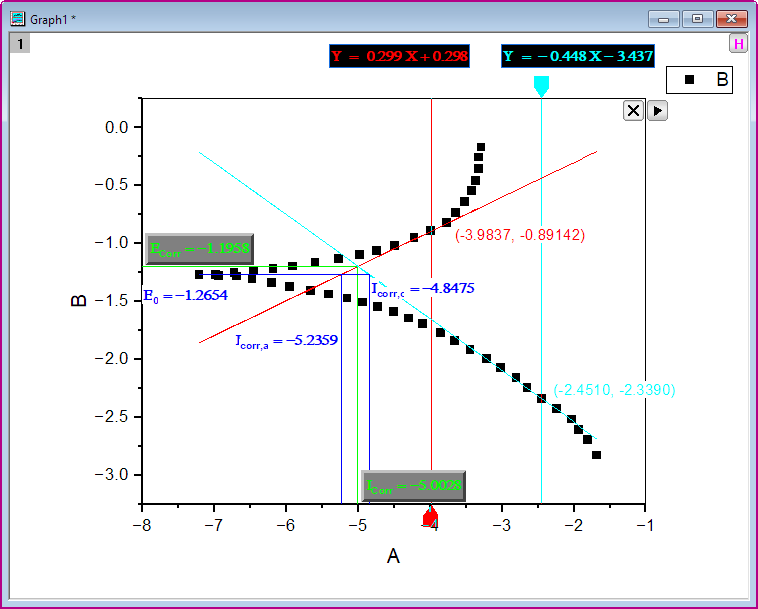
- Drag the red and cyan cursor at the bottom/ top of X Axis to move the two vertical lines to the positions as the following image shows. And you can see the corresponding results are updated on the graph.
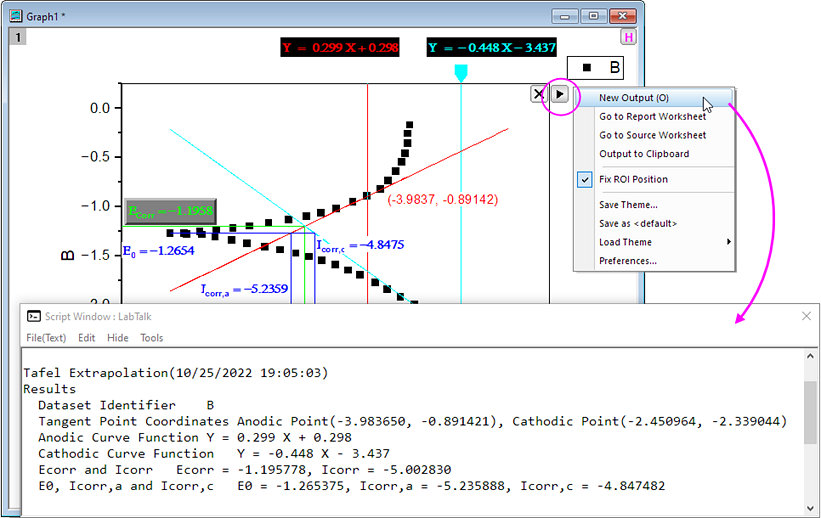
- Click the
 button, and then select New Output (O), then the result will be printed to Script Window. button, and then select New Output (O), then the result will be printed to Script Window.
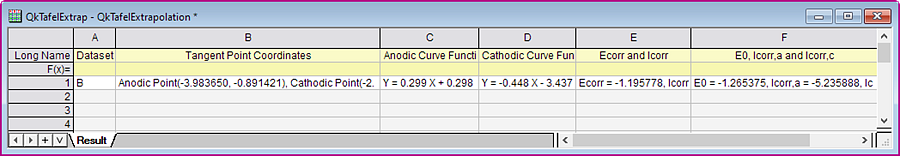
- Click the button, and then select Go to Report Worksheet, then the report worksheet will be the active window to show the output results.
Dialog Settings
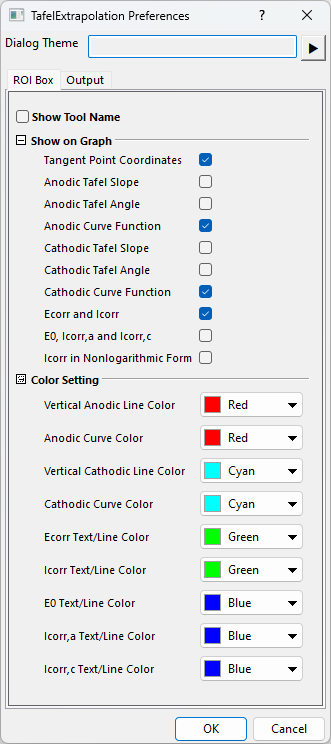
ROI Box Tab
| Show Tool Name
|
Specify whether to show the tool's name near the top left corner of the layer.
|
| Show on Graph
|
Specify what to show on the graph.
- Tangent Point Coordinates
- Specify whether to show the XY coordinate of the tangent point on the graph.
- Anodic Tafel Slope
- Specify whether to show the anodic Tafel slope of anodic curve on the graph.
- Anodic Tafel Angle
- Specify whether to show the anodic Tafel angle of anodic curve on the graph.
- Anodic Curve Function
- Specify whether to show the expression of anodic curve function on the graph.
- Cathodic Tafel Slope
- Specify whether to show the cathodic Tafel slope of cathodic curve on the graph.
- Cathodic Tafel Angle
- Specify whether to show the cathodic Tafel angle of cathodic curve on the graph.
- Cathodic Curve Function
- Specify whether to show the expression of cathodic curve function on the graph.
- Ecorr and Icorr
- Specify whether to show the corrosion potential and corrosion current on the graph.
- E0, Icorr,a and Icorr,c
- Specify whether to show E0, Icorr,a and Icorr,c on the graph.
- Icorr in Nonlogarithmic Form
- Specify whether Icorr in Nonlogarithmic Form
- Logarithmic Base
- Specify Logarithmic Base. Available if above checkbox is checked.
|
| Color Setting
|
Specify the corresponding object's displaying color, of which:
- Vertical Anodic Line Color
- Specify the color of the vertical line, which is used to select a point from the curve of graph, so to get the tangent line through this point as anodic curve.
- Vertical Cathodic Line Color
- Specify the color of the vertical line, which is used to select a point from the curve of graph, so to get the tangent line through this point as cathodic curve.
|
Output Tab
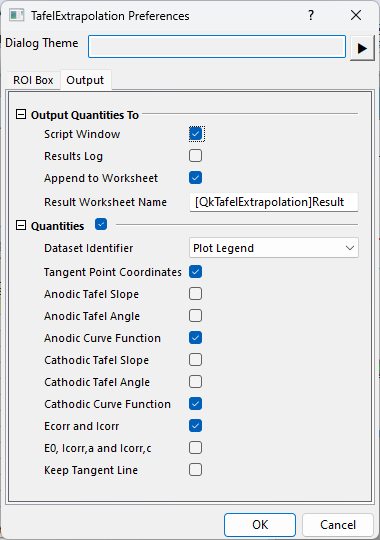
| Output Quantities To
|
Customize the output results
- Script Window
- Specify whether to output the results to Script Window.
- Results Log
- Specify whether to output the results to Results Log.
- Append to Worksheet
- Specify whether to append the results to a worksheet.
- Result Worksheet Name
- This is only available when Append to Worksheet is checked. It is used to specify the name of the worksheet.
|
| Quantities
|
Specify the quantities to be outputted.
- Dataset Identifier
- Specify a dataset identifier.
- Tangent Point Coordinates
- Specify whether to output the XY coordinate of the tangent point.
- Anodic Tafel Slope
- Specify whether to output the anodic Tafel slope of anodic curve.
- Anodic Tafel Angle
- Specify whether to output the anodic Tafel angle of anodic curve.
- Anodic Curve Function
- Specify whether to output the expression of anodic curve function.
- Cathodic Tafel Slope
- Specify whether to output the cathodic Tafel slope of cathodic curve.
- Cathodic Tafel Angle
- Specify whether to output the cathodic Tafel angle of cathodic curve.
- Cathodic Curve Function
- Specify whether to output the expression of cathodic curve function.
- Ecorr and Icorr
- Specify whether to output the corrosion potential and corrosion current.
- E0, Icorr,a and Icorr,c
- Specify whether to output E0, Icorr,a and Icorr,c
- Keep Tangent Line
- Specify whether to keep Tangent Line after remove the Tafel Extrapolation gadget.
|
Fly-out Menu
Click the button at the upper-right corner of the layer to expand the fly-out menu, which includes the following options.
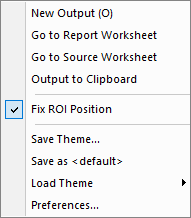
| New Output (O)
|
Output the results to the specified windows (Script Window or Results Log), and the specified worksheet (if not empty, append the results).
|
| Go to Report Worksheet
|
Activate the report worksheet.
|
| Go to Source Worksheet
|
Activate the source data worksheet.
|
| Output to Clipboard
|
Output the results to clipboard.
|
| Fix ROI Position
|
Specify whether to fix ROI position.
|
| Save Theme
|
Save the settings as a theme.
|
| Save as <default>
|
Save the settings as default theme.
|
| Load Theme
|
Load theme settings.
|
| Preferences
|
Open the TafelExtrapolation Preferences dialog.
|
More Info
The following image shows the relationships about the calculating options.
|