Description:
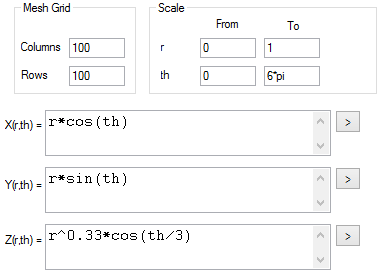
This is a 3D parametric function plot created form File: New: Function Plot: 3D Parametric Function Plot...
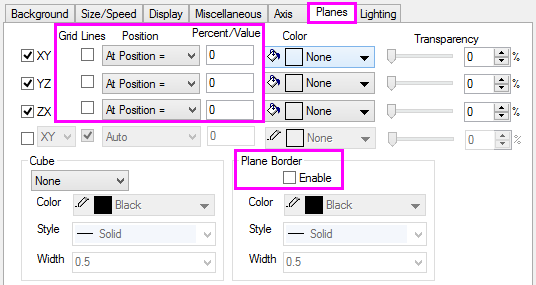
All three planes have been moved to the position of zero, with grids and border turned off in Plot Details dialog, Plane tab
All three axis are also moved to intersect at zero by Axis Dialog, Line and Ticks node. The direction of ticks on Y axis is changed to in so that they will not overlap with the surface.
To see more 3D Function plots, please refer to: 3D Function Gallery.