Back to Top
OriginLab Corporation - Data Analysis and Graphing Software - 2D graphs, 3D graphs, Contour Plots, Statistical Charts, Data Exploration, Statistics, Curve Fitting, Signal Processing, and Peak Analysis      
Buy Now Try Demo
Skip Navigation Links.

LOWESS and LOESS Smoothing Graph


Show more of same type...            Show more using same keywords...

Download this project to learn how to make the graph.


Description

The graph displays smoothing results using LOESS or LOWESS methods.The name Lowess and Loess is the abbreviation for locally weighted scatter plot smoothing. It is best used when there are a large number of data points.

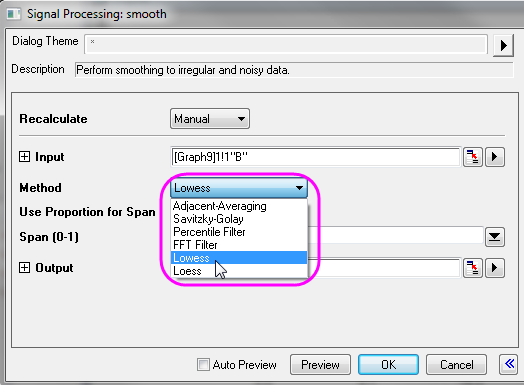
To apply LOESS or LOWESS smoothing prcessing to a certain scatter plot, click Analysis: Signal Processing: Smooth to bring out the Smooth dialog.

© OriginLab Corporation. All rights reserved.
× _ Let's Chat