Back to Top
OriginLab Corporation - Data Analysis and Graphing Software - 2D graphs, 3D graphs, Contour Plots, Statistical Charts, Data Exploration, Statistics, Curve Fitting, Signal Processing, and Peak Analysis      
Buy Now Try Demo
Skip Navigation Links.

Akima Interpolation Graph


Show more of same type...            Show more using same keywords...

Download this project to learn how to make the graph.


Description

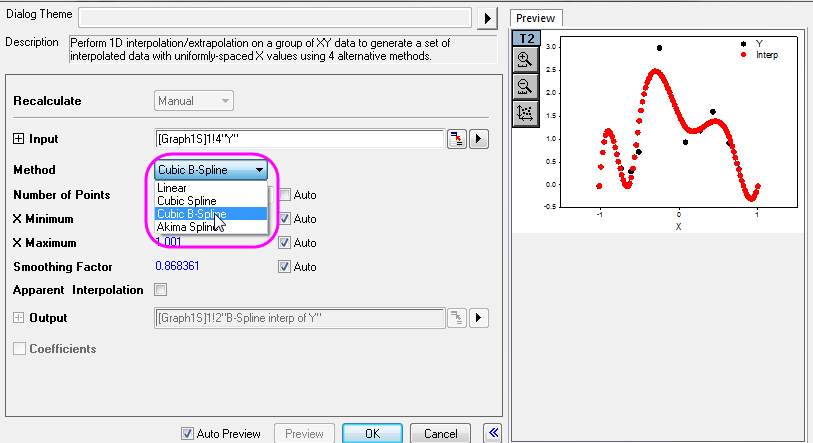
The graph is created using Intepolate Gadget .It displays interpolated results with three methods: Spline, B-Spline and Akima Spline.

Click on the green locks in the graph and select Change Parameters…from context menu to open Interpolation dialog.

Akima Spline can also be selected as a line connection method for Line or Line+Symbol plots. The control is available in the Line tab of Plot Details at the Plot Properties level.

© OriginLab Corporation. All rights reserved.
× _ Let's Chat