Description:
This graph displays a polar plot where the angular axis has been set to the partial range of 60 degrees to -60 degrees.
The partial angular range was set using the following steps:
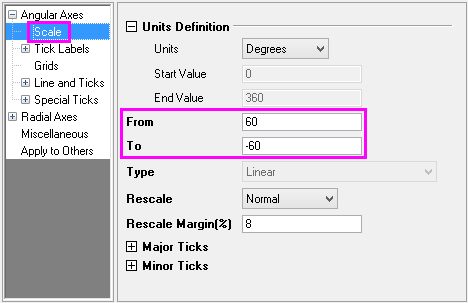
1. In the Axis Dialog box, Scale page, the From and To value were set to be 60 and -60 respectively, to display a right partial circle. Note that the From value is large than the To value.
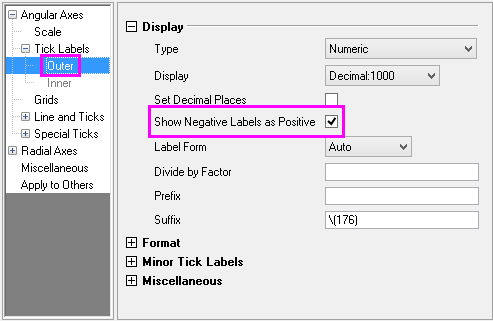
2. Then, the Show Negative Label as Positive check box was checked to force label values into the 0~360 range.