Description:
This graph displays a 3D Colormap Surface plot generated from XYZ data from a worksheet, where the data has uneven spacing in X and Y. The raw data has beed added as a 3D Scatter plot, and the symbols have been assigned the same color map as the surface.
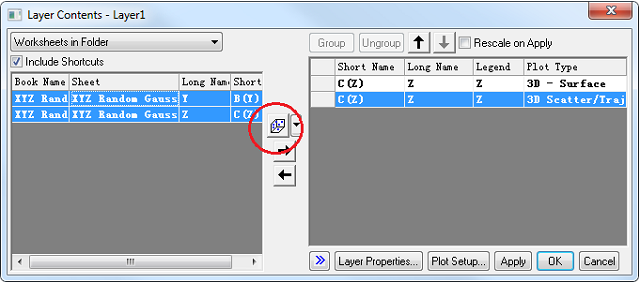 |
Add 3D Scatter plot. |
| |
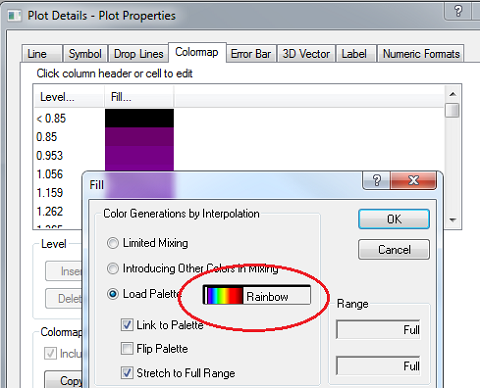 |
Set Colormap/Fill to "Rainbow" |