Description:
3 Point Segment Graph is a special kind of line and symbol graph where the line connection is set to 3 Point Segment automatically.
Here, the graph shows the temperature trends in four quarters.
|
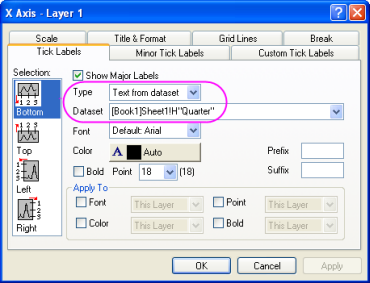
Use Axis dialog to set the Scale tab. Under the Tick Labels tab, setting Text from Dataset as the Tick Labels type, select a dataset from any worksheet in the project by typing or selecting the dataset from the Dataset combination box. |
|
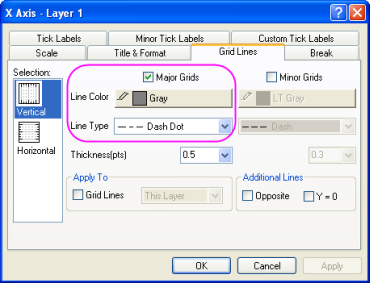
Show the Grid Lines and customize the line type. |