Description
This graph consists of two intersecting surface plots with transparency and different color fill.
There is a similar graph in the Graph Gallery, you can see the details of transparency and intersection
there.
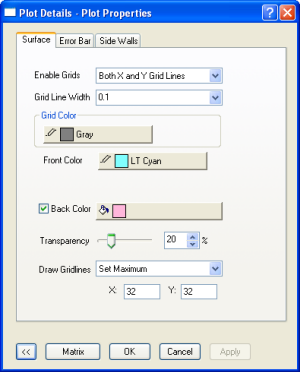
Set different fill color for the multiple surfaces, and set transparency for the surface separately.