Learn how to create this graph here.
Description:
This graph displays the result of a 2D Gaussian surface fit to the XYZ scatter data. The fit surface is displayed with transparency to enable the viewing of scatter points behind the surface. Drop lines are drawn from the scatter points to the fitted surface.

The XYZ scatter plot is created from the XYZ worksheet data. The 2D Gaussian surface is created from the matrix, which is the result of a 2D Gaussian surface fitting to the XYZ scatter data.
|

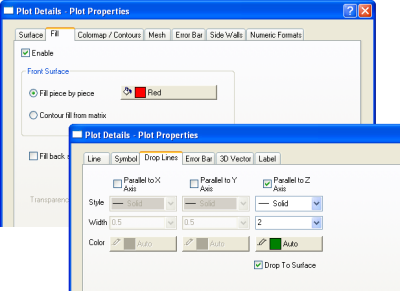
In this example, drop lines are turned on, and can be drawn from the symbols to either the XY plane or to the surface plot in the same layer. Select the Drop Lines tab in the Plot Details dialog to access these controls. |