General Improvements:
Support slider in Flip Through dialog.
Increased speed when selecting "All Columns from Same Sheet" from drop down menu.
“Column Index” column is not left aligned in table in control panel.
Fixed error with legend when too many entries.
Show Column Index number if no column long name and there are many columns
Spawn New Graph with Selected Feature (from drop down) allows a new, non-Browser Graph to be created from selected columns in control panel table.
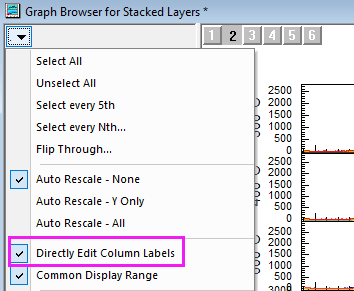
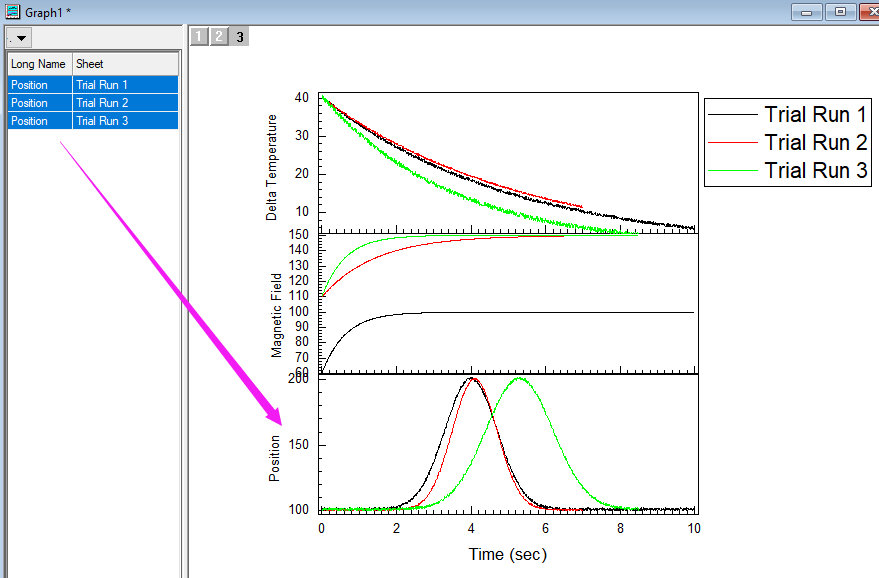
Direct Edit Column Labels. Once it’s checked, user can double click to modify it
Multi-layer Browser Graph Improvements:
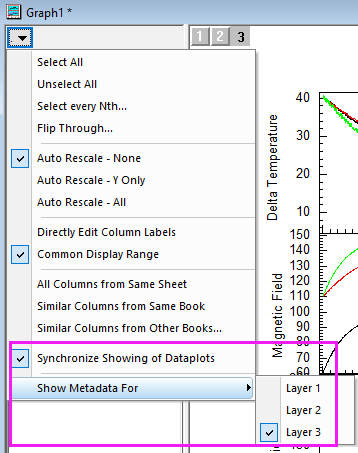
To enable/disable plot show/hide together with other layers, select Synchronize Showing of Dataplots from fly-out button. By default, plot show hide together base on plot index. To show hide by metadata, go to Plot Details page level Layers tab.
To select plot by metadata of other layer, select Show Metadata/Contents for from fly-out button, select layer from fly-out. To show hide plot independently for each layer, please uncheck Synchronize Showing of Dataplots before switch layers
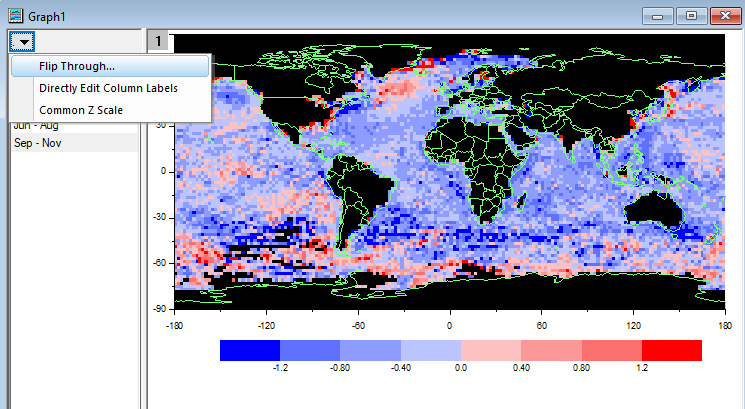
Browser graph for Image and Contour Plot:
Turn on Browser panel by page level mini toolbar. Then flip images on same matrix sheet. User can edit the metadata on left panel
Common Z Scale is used by default for all matrices in the layer.