- Note: you can also run
pemp_pptslide -d;in the command window to bring up the dialog box.
Highlight and right click on the graphs in the Project Explorer: Send Graphs to PowerPoint
Send specific graphs to PowerPoint
Minimum Origin Version Required:8.1 SR0
This X-Function has been updated since 9.1 SR0, implementing with the page, mode, custom, slide, srcf, dstf variable and the GUI access of title variable.
1.pemp_pptslide pages:="Graph1%(LF)Graph2" insert:=pic title:=top mode:=slname;
2.pemp_pptslide pages:=%H top:=10 bottom:=10 left:=10 right:=10 title:=2;
Please refer to the page for additional option switches when accessing the x-function from script
| Display Name |
Variable Name |
I/O and Type |
Default Value |
Description |
|---|---|---|---|---|
| Graph Pages | pages |
Input string |
|
Specifies the graph windows to be exported. Use %(CRLF) or %(LF) as separator between the graph windows. |
| Insert Graphs as | insert |
Input int |
|
Specify the form of graphs when exported to PowerPoint slides.
Option list:
|
| Top Margin (%) | top |
Input double |
|
Specify the top margin of the slide. |
| Left Margin (%) | left |
Input double |
|
Specify the left margin of the slide. |
| Bottom Margin (%) | bottom |
Input double |
|
Specify the bottom margin of the slide. |
| Right Margin (%) | right |
Input double |
|
Specify the right margin of the slide. |
| Title Line | title |
Input int |
|
Specifies how the title will be shown in the PowerPoint slides.
Option list:
|
| Title Mode | mode |
Input int |
|
This variable is only available when the title variable is not 0. It specifies what should be used as the exported graph title in each slide.
Option list:
|
| Custom Title String | custom |
Input string |
|
This variable is only writable when mode is set to custom. It uses to specify a custom string to be used as slide title. |
| Starting Slide Index | slide |
Input int |
|
Define the start slide index in the PowerPoint presentation file for exported graphs. |
| Source File Name | srcf |
Input string |
|
Specify a PowerPoint template file for the exported slides. |
| Destination File Name | dstf |
Input string |
|
Specify the name of the PowerPoint Presentation file (*.ppt;*.pptx;*.pptm), PowerPoint Show (*.pps;*.ppsx;*.ppsm) or Design Template (*.pot;*.potx;*.potm). Slides will be exported to this file. |
This function is used to export the selected graphs into PowerPoint slides. Each graph will be pasted into one slide in the PowerPoint file. The order of exportation is the slide order (which can be seen in the Project Explorer) of the graphs.
Note: To export graphs to PowerPoint slides, Microsoft Office must have been installed. If the version of Office is 2007, Office has to be upgraded to SP2. Or this X-Function will not work fine.
This example will show how to export four selected graphs to PowerPoint slides.
pemp_pptslide -d; in the command window to bring up the dialog box.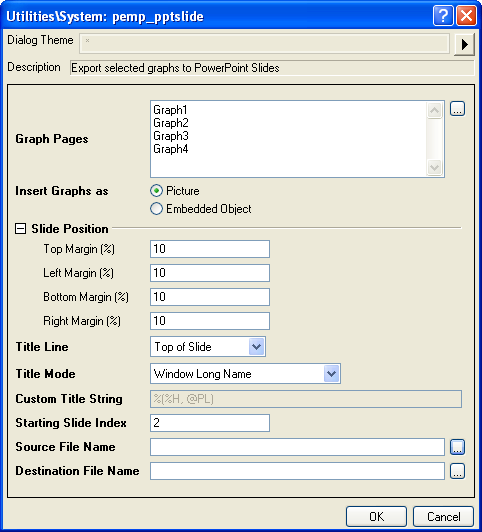
pemp_slideshow, pef_pptslide, pef_slideshow
Keywords:publishing, export