Display
Name
|
Variable
Name
|
I/O
and
Type
|
Default
Value
|
Description
|
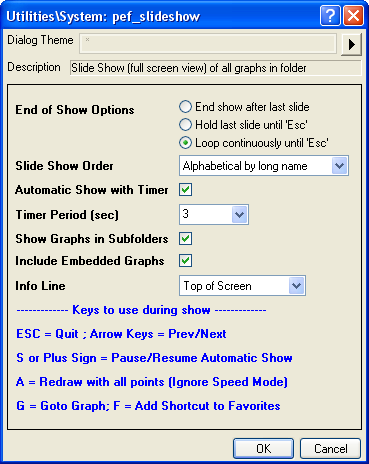
| End of Show Options
|
end
|
Input
int
|
0
|
Specify the operation to perform after the whole slide show is run.
Option list:
- 0:End Show after Last Slide
- End the slide show after entire presentation is run
- 1:Hold Last Slide until 'Esc'
- Keep showing the last graph in the end of presentation until the Esc key is pressed.
- 2:Loop continuously until 'Esc'
- Loop the graphs over and over until the Esc key is pressed.
|
| Slide Show Order
|
order
|
Input
int
|
0
|
Specify the order of graphs in the slide show.
Option list:
- 0:By slide indices
- Show the graphs in the the order of slide indices.
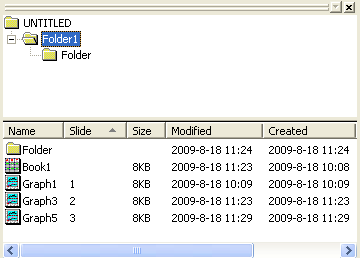
- To view slide indices in PE, make sure Project Explorer is in Detailed view mode and Slide column shows. If Slide column is hidden, right click column header in Project Explorer to check Slide context menu.
- To skip a graph in slide, right click the graph in Project Explorer and choose Skip Slide.
- By default, the slide index order is the graph creation order. To change the slide order, in Detailed view of Project Explorer, first click once on Slide column header so the graphs are sorted by slide index. Then drag a graph row up or down. The corresponding slide indice will change. E.g. To make Graph2 (slide index 2) show before Graph1 (slide index 1) in slide, when Project Explorer is sorted by Slide column, drag Graph2 above Graph1 in Project Explorer. Slide index of Graph2 becomes 1 while slide index of Graph1 becomes 2.
- 1:Use current folder order
- Show the graphs in the order as what you see in the Project Explorer.
- 2:Alphabetical by long name
- Show the graphs in the alphabetical order of their long names.
- 3:Alphabetical by short name
- Show the graphs in the alphabetical order of their short names.
- 4:Last modified ascending
- Show the graphs in the ascending order of their last modified time
- 5:Last modified descending
- Show the graphs in the descending order of their last modified time.
- 6:Creation ascending
- Show the graphs in the ascending order of their creation time.
- 7:Creation descending
- Show the graphs in the descending order of their creation time..
|
| Automatic Show with Timer
|
timer
|
Input
int
|
0
|
Specify whether to automatically show the next graph with timer.
|
| Timer Period (sec)
|
period
|
Input
double
|
2
|
It is available only when Automatic Show with Timer has been selected. It specifies the time (in seconds) a graph appears on the screen before the function switches to the next graph.
|
| Show Graphs in Subfolders
|
recursive
|
Input
int
|
1
|
Specify whether to show the graphs in subfolders.
|
| Include Embedded Graphs
|
embed
|
Input
int
|
0
|
Specify whether to export embedded graphs to PowerPoint slides.
|
| Info Line
|
info
|
Input
int
|
1
|
Specify the position to show the information about the current graph, which includes the path and the name of the graph.
Option list:
- Do not show the information.
- Show the information at the top of the screen.
- Show the information at the bottom of the screen.
|
This X-Function can be used to start a slide show for graphs in a specified folder. It enables you to control over the presentation. You can set the graph order, decide whether and how to automatically run the slide show.