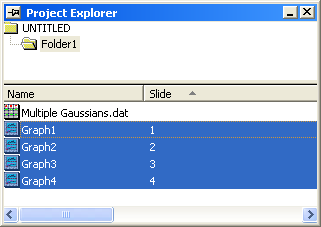
pemp_slideshow -d; in the command window to bring up the dialog.Highlight and right click on the graphs in the Project Explorer: Slide Show of Graphs
Slideshow of specific graphs within Origin
Minimum Origin Version Required: 8.1 SR0
pemp_slideshow end:=hold timer:=1 period:=2;
Please refer to the page for additional option switches when accessing the x-function from script
| Display Name |
Variable Name |
I/O and Type |
Default Value |
Description |
|---|---|---|---|---|
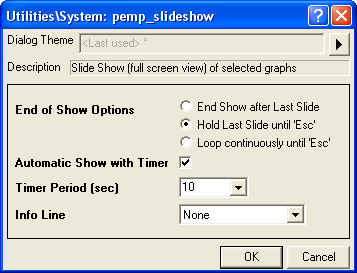
| End of Show Options | end |
Input int |
|
Specify the operation to perform after the whole slide show is run.
Option list:
|
| Automatic Show with Timer | timer |
Input int |
|
Specify whether to automatically show the next graph with timer. |
| Timer Period (sec) | period |
Input double |
|
It works only when Automatic Show with Timer has been selected. It specifies the duration time (in seconds) for each slide. |
| Info Line | info |
Input int |
|
Specify the position to show the information about the current graph, which includes the path and the name of the graph.
Option list:
|
This X-Function is used to start a slide show for the selected graphs. Each graph will be shown as one slide. The order of show is the slide order (which can be seen in the Project Explorer) of the graphs.
This example is used to show four selected graphs in full screen.
pemp_slideshow -d; in the command window to bring up the dialog.