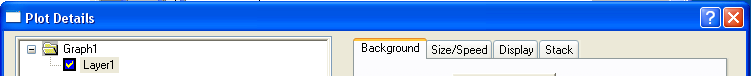
The Plot Details dialog box layer-level tabs provide controls for layer color, layer size, data clipping, hiding graph elements, scaling of elements when the layer is resized, and the skipping of data points. While the graph window contains only a single page, it can contain multiple graph layers, and each layer may be configured independently using these layer-level controls.
The layer-level controls of 2D graph
The layer-level controls of 3D graph

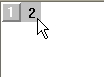
Each layer in the graph window is numbered and is denoted by a small, gray icon in the upper-left corner of the graph page. These layer icons provide a visual cue as to the number of graph layers in the window and as to which graph layer is active layer. They are not printed or exported with the graph. The display of the layer icon can, in fact, be toggled on or off with a menu command (View: Show: Layer Icons).
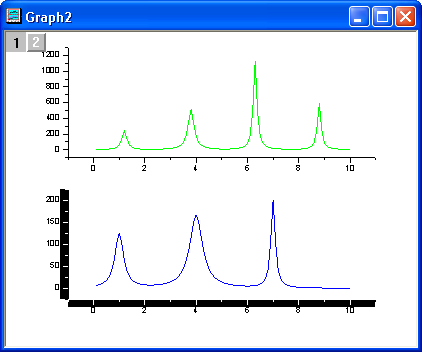
As mentioned, one important function of the layer icon is to provide a visual cue as to the active layer. A graph page may have multiple layers, but only one layer in that page is active at any given time. The active graph layer is indicated by a depressed layer n icon (the icon is "flat" and the numeral is black). In this figure, layer 2 is the active layer.
When you customize a multi-layered graph via the user-interface, you necessarily act on the active layer. If the desired layer is not already active, you must activate it before customizing the size or appearance of the layer.
To make a graph layer active, do one of the following:
or
or
or
Note that if the Plot Details dialog box is open, you can select any layer on the page by highlighting the associated layer icon in the left panel of the dialog box. This effectively allows you customize a layer's properties without performing one of the above actions.
The active layer will also be indicated by highlighted graph axes, if the View: Show: Active Layer Indicator menu command is checked. Note that this active layer indicator (see the picture below) is not turned on globally; it must be applied to each graph page.
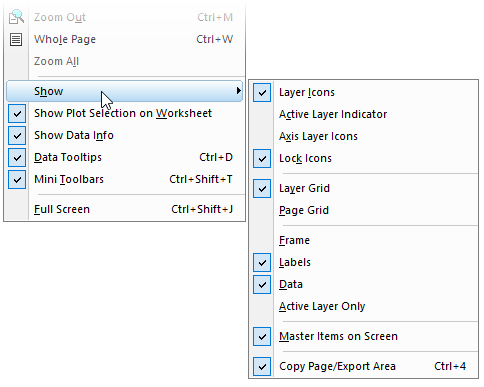
In addition to the layer icons, there are a number of common graph page elements that can be displayed or hidden by selecting View: Show and checking or unchecking an element. Among them are the ... |
By default, the layer does not display a background color; it is transparent. Any color that is subsequently applied to the graph page also displays in each layer on the page. The layer border is a bounding box outside of the layer frame. Controls for adding a layer (background) color and a border are found on the Background tab of the layer's Plot Details dialog box.
To add a background color to a layer:
To display the layer border:
You can make approximate adjustments to the size of the graph layer by selecting the layer and dragging a control handle.
To move or resize the layer:
To make more precise adjustments, you can edit the layer dimensions using controls on the Size tab of the layer's Plot Details dialog box.
To open the Size tab of Plot Details:
To numerically position or resize the layer, type values in the Left, Top, Width, and Height text boxes. The Left text box value determines the position of the frame relative to the left side of the page. The Top text box value determines the position of the frame relative to the top of the page. The Height and Width text box values determine the size of the frame. Specify the units with the Units drop-down list.
|
Note:
|
Speed mode and graphic image caching controls are on the Display/Speed tab of the layer's Plot Details dialog box.
There are a number of graph elements that may be resized when you resize the graph layer. These include axis tick labels, label objects such as the graph legend and possibly added graph annotations (text and drawing objects). Since you may or may not want this to happen, there is a Plot Details setting that provides control over element scaling.
Use of the layer's Scale Elements controls are covered in the following topics in the Origin Help file:
The Plot Details Display tab contains controls for showing or hiding various graph elements. To learn more see Hiding elements in the graph layer in the Origin Help file.
The Display tab of Plot Details also has controls for:
To learn more, see Controlling the Display and Scaling of the Objects in a Layer in the Origin Help file.
Data plots and other objects associated with the plot (data labels, error bars) that extend beyond the layer frame, can be hidden in the graph page.
To show the layer frame(s) for the active graph page, choose View: Show: Frame. |
To clip the data plot in the active graph layer:
Clip data behavior changed slightly beginning with Origin 2019b. See this FAQ for information. |
To set the clipping margins inside or outside the layer frame:
For more information on Clip Data controls, see documentation for the Plot Details Display/Speed tab.
To align/center a graph object or a graph layer to the graph page,
To clip 3D OpenGL plots and control the margins:
When you add a text or drawing object to an Origin graph, it becomes part of the graph layer that was active at the time of object creation. This is true even if the object is created outside the layer frame (in which case, it might be attached to the graph page; see Object Attachment and Scaling for more information).
By default, such objects are not clipped to the layer frame. Such objects placed outside the layer frame will, by default, remain visible. However, you may encounter situations where you do not want an object to display outside the layer frame.
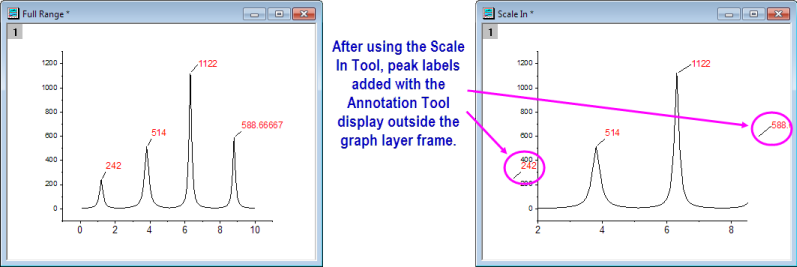
You can fix such problems by setting a stray object's clip property to 1.
ObjectName.clip=1; // object follows Plot Details Clip Data to Frame property of the containing layer.
This forces object clipping to follow the Clip Data to Frame property of the containing layer; if Clip Data is turned on for the layer, any contained object for which the clip property is set to 1, will be hidden if it lies outside the layer frame. Note that this property must be set for each object, individually.
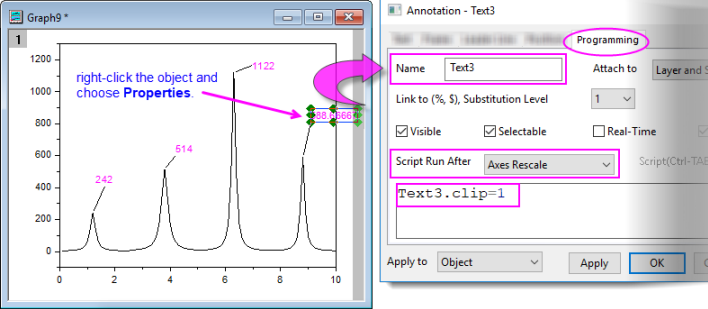
For information on associating graphic objects with LabTalk script, or on the ObjectName.clip property, see Graphic Objects.
For 3D graph, you can enter length and angle value to rotate the graph.
To rotate the 3D surface, you can
In 3D graph layers, you can control the position and display of the XY, YZ, and ZX planes.
To move the XY plane to the middle of Z axis,
In the 3D graph layer, you can control the lighting of 3D plots, including the light position and light colors.
To add lighting on the 3D surface, you can