Starting with Origin 2018 SR0, there is a GUI tool that uses the pickpts X-Function. The tool is opened by right-clicking on the data point tooltip that shows when you mouse over a data point in a line, scatter, line + symbol or column/bar chart.
Pick XY data points from a 2D graph.
Minimum Origin Version Required: 8.1 SR3
1. pickpts npts:=3;
2. pickpts gp:=[Graph2] npts:=5 plot:=<new>;
Please refer to the page for additional option switches when accessing the x-function from script
| Display Name |
Variable Name |
I/O and Type |
Default Value |
Description |
|---|---|---|---|---|
| Input Graph | gp |
Input GraphPage |
|
Specifies the graph to pick points from |
| Number of Points to Get | npts |
Input int |
|
Specifies the number of points to pick from the input graph |
| Reader Type | type |
Input int |
|
Specifies the type for picking points
Option list:
|
| X Coordinates | x |
Output vector |
|
Specifies the output range for picked points’ X coordinates. |
| Y Coordinates | y |
Output vector |
|
Specifies the output range for picked points’ Y coordinates |
| Plot Name | plot |
Output vector<string> |
|
Specifies the output range for plot name(s) of the picked data points. It is accessible only when Data Reader is selected for Reader Type. |
| Point Index | index |
Output vector |
|
Specifies the output range for data points’ indices. It is accessible only when Data Reader is selected for Reader Type. |
This X-Function allows you to pick XY data points from a graph using the Data Reader type or Screen Reader type and gets related coordinate information.
Starting with Origin 2018 SR0, there is a GUI tool that uses the pickpts X-Function. The tool is opened by right-clicking on the data point tooltip that shows when you mouse over a data point in a line, scatter, line + symbol or column/bar chart. |
The following scripts shows how to pick data points from multiple layers.
// create a new worksheet window based on ORIGIN.OTW
win -t;
// fill the worksheet with row numbers in the first two columns
col(A) = data(1,10);
col(B) = data(1,10);
// fill the third and forth columns with normal random numbers
col(C) = Normal(10);
col(D) = Normal(10);

// highlight second to forth columns
worksheet -s 2 0 4 0;
// plot a 3Ys_Y-Y-Y graph from the selected three columns
run.section(Plot,3Ys_Y-Y-Y);

// pick up 5 points from graph, and output their XY coordinates, plot names and indices
pickpts npts:=5 plot:=<new> index:=<new>;
With the graph active, double-click on data points of interest to select them:
After the selection is done, the results are automatically output to a new worksheet:
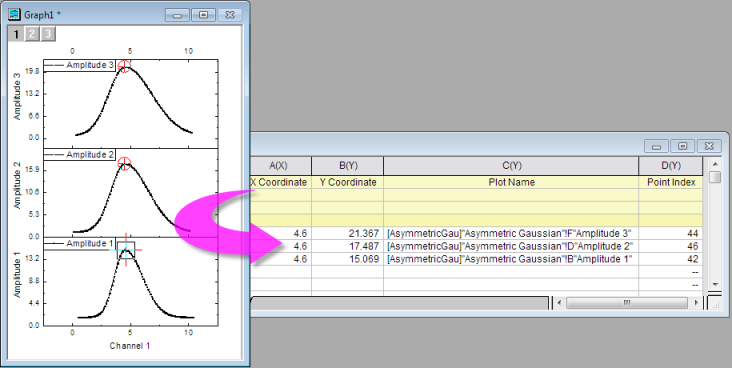
In this example, we have a three panel (layer) graph, with each layer containing a plot of Assymmetric Gaussian data. We use pickpts to pick the peak point in each and output the result to Book2. Note that we are using a variable of type StringArray to store and output the plot names. Also, see StringArray (object).
// create datasets dsx and dsy
dataset dsx, dsy;

// create StringArray dsn
StringArray dsn;

// call the pickpts X-Function, use Data Reader to pick 3 points.
// Put X coordinates in dsx, y coordinates in dsy, point index in dsi, and plot name in dsn
pickpts npts:=3 type:=data x:=dsx y:=dsy index:=dsi plot:=dsn;

// define output sheet range with 4 columns
range wks = [Book2]Sheet1!;
wks.ncols=4;

// assign long names to each column
wks.col1.lname$ = X Coordinate;
wks.col2.lname$ = Y Coordinate;
wks.col3.lname$ = Plot Name;
wks.col4.lname$ = Point Index;

// create range variables for each output variable
range aa = [Book2]1!1;
range bb = [Book2]1!2;
range cc = [Book2]1!3;
range dd = [Book2]1!4;

// output coordinate and index values to Book2
aa = dsx;
bb = dsy;
dd = dsi;

// copy StringArray dsn to range cc ([Book2]1!3;)
dsn.CopyTo(cc);
Note: Since Origin 2017 SR0, we can also use a variable of type Dataset to store and output the plot name. For instance, we can change the above example as follows:
|